ESG themed investments continue to gain popularity, and the relatively new (and red hot) Carbon ETF (KRBN) is no exception.
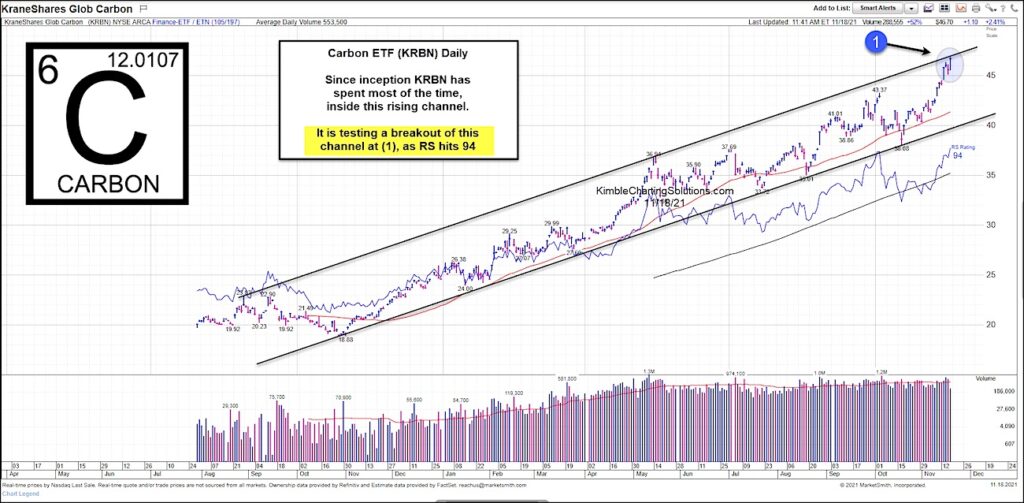
This index follows the European and North American cap and trade carbon markets. And since its inception, it has spent most of the time inside a rising bullish price channel.
That is the definition of a strong up-trend.
This is highlighted on today’s “daily” chart of the Carbon ETF (KRBN).
The recent rally has KRBN testing the top of its price channel. And at the same time, its relative strength is at 94. Is it ready to breakout of this channel and head higher yet? Or is it overheated and in need of a breather. Stay tuned!
Carbon ETF (KRBN) “daily” Chart
Note that KimbleCharting is offering a 2 week Free trial to See It Market readers. Just send me an email to services@kimblechartingsolutions.com for details to get set up.
Twitter: @KimbleCharting
Any opinions expressed herein are solely those of the author, and do not in any way represent the views or opinions of any other person or entity.


