Last Thursday’s overnight equity futures swoon and Friday’s subsequent recovery highlighted the recent injection of volatility in the capital markets.
And with this in mind, I thought it would be helpful to share a handful of annotated charts I’m watching and analyzing that highlight some of the divergences, extremes, supports and resistances currently in play in the capital markets.
Let’s review the charts and setups:
S&P 500 Stays In the Cloud
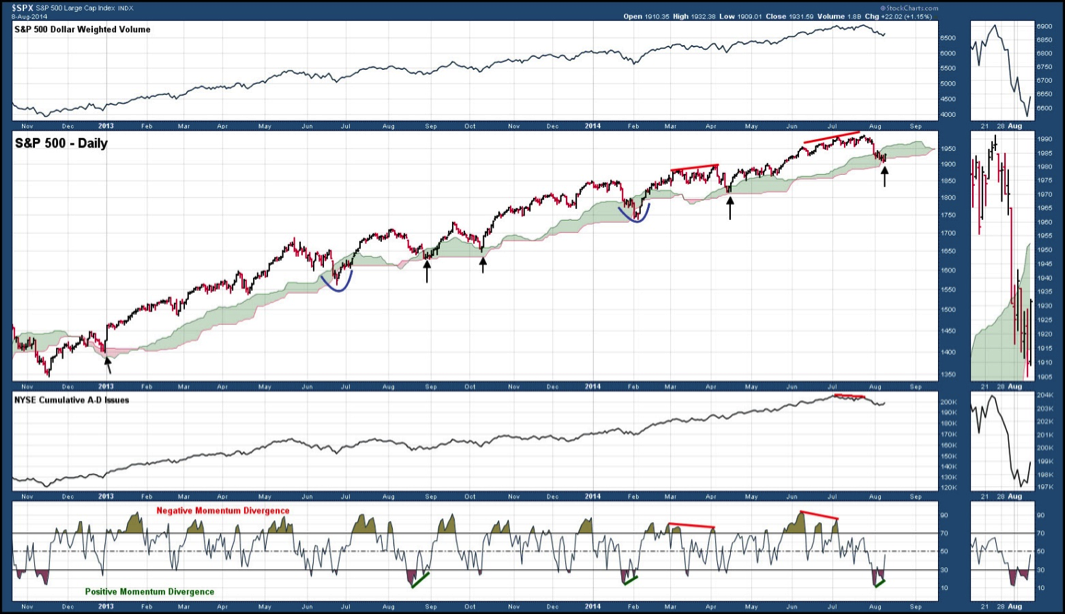
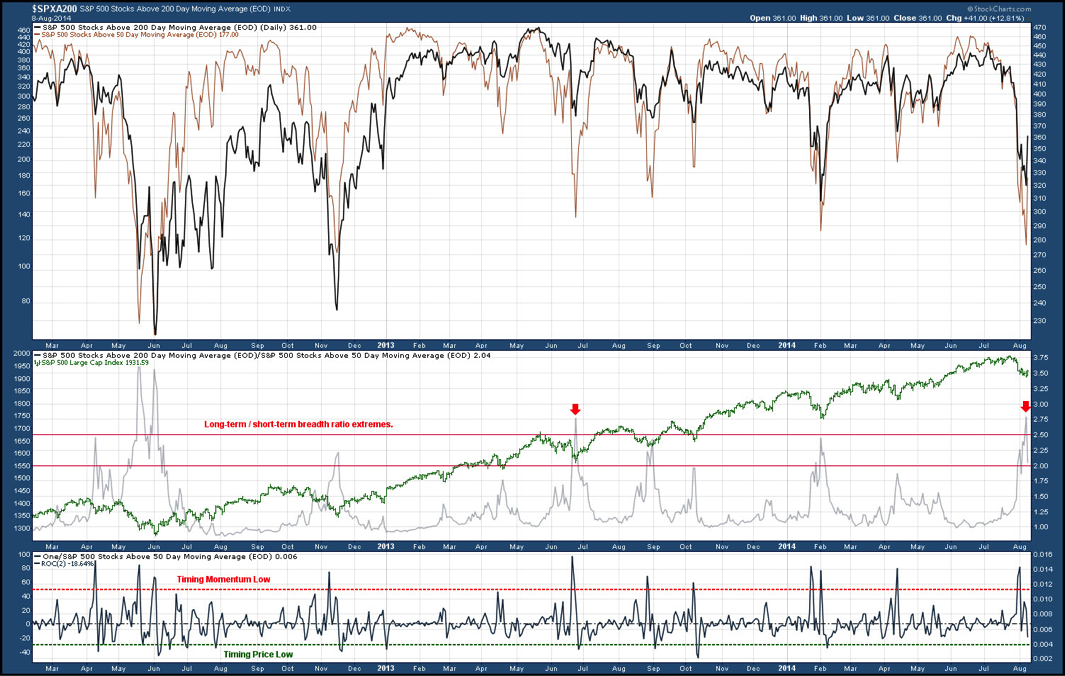
Defining S&P 500 Momentum and Price Lows
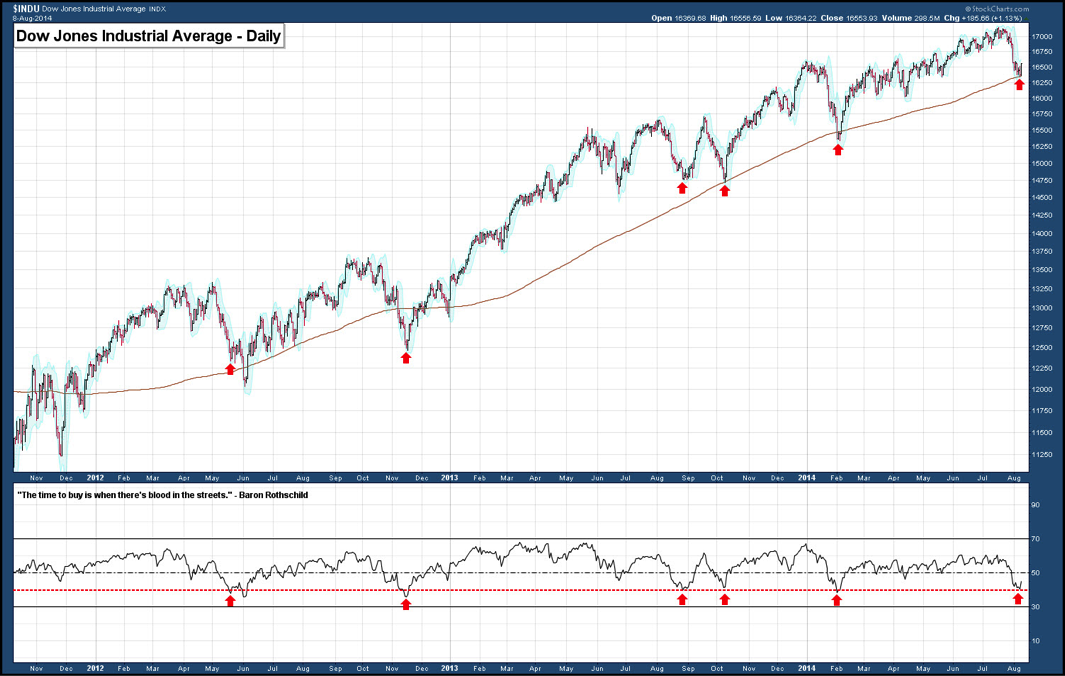
Dow Jones Industrial Average Extreme Oversold Condition
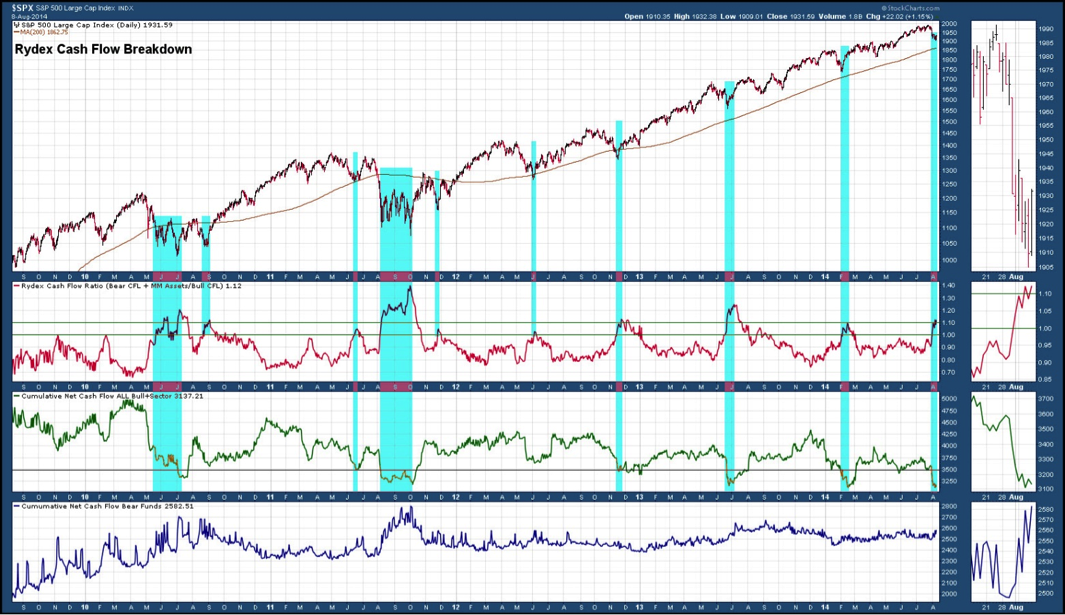
Cash Flows Show Equity Market Flight
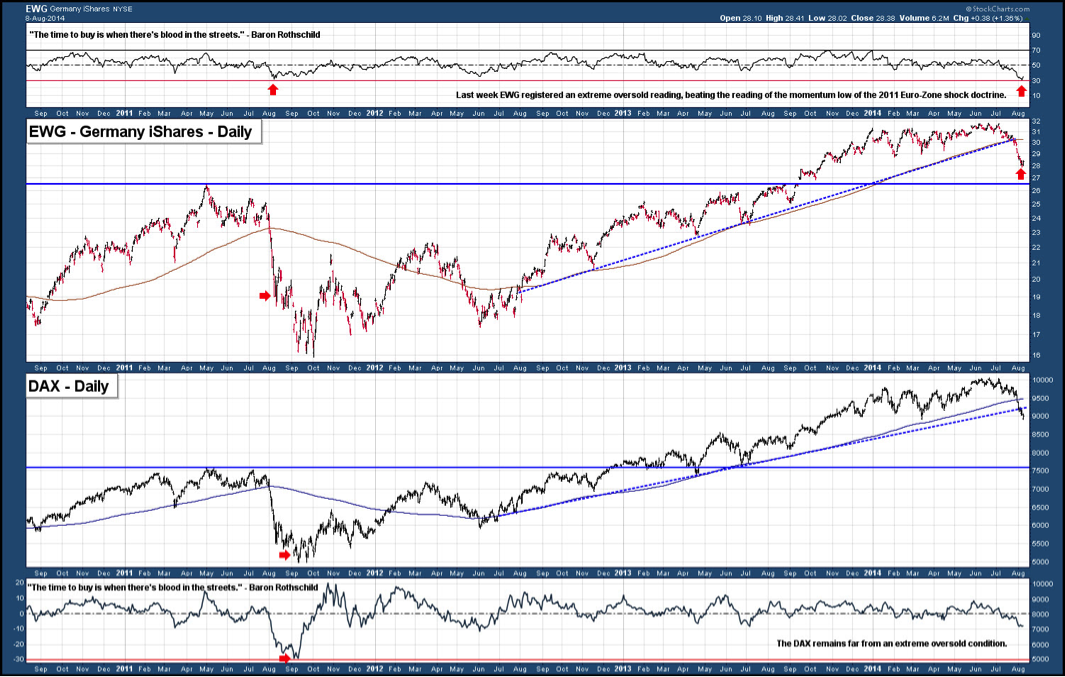
Germany Most Oversold Since 2011 Shock Doctrine
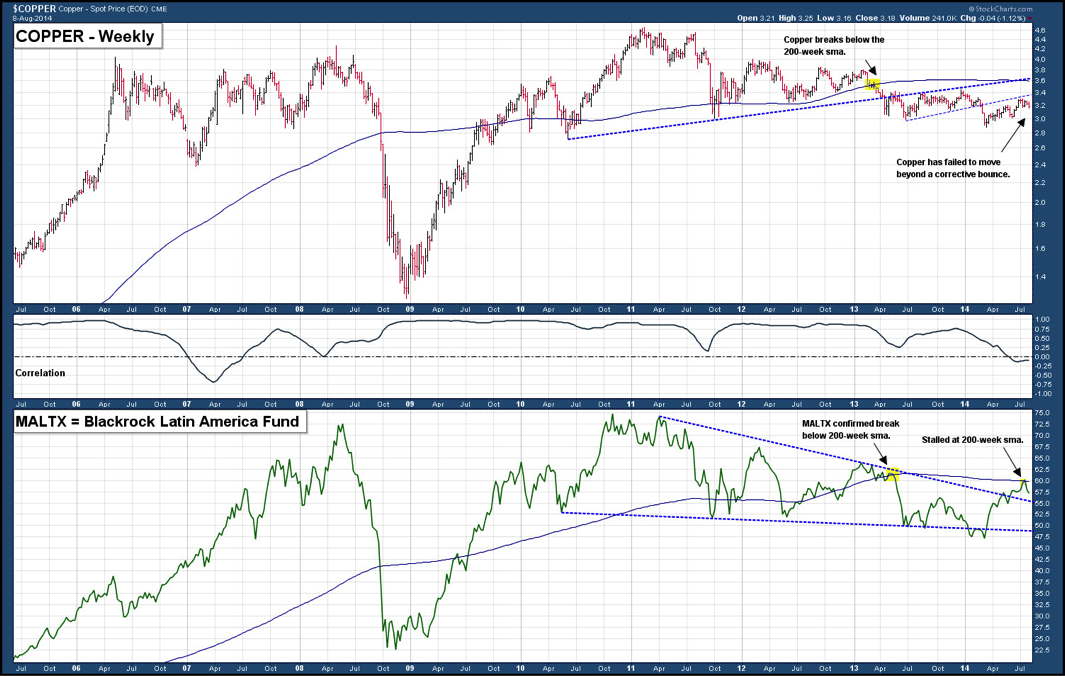
Latin America Stocks Stall with Copper Showing Bearish Divergence
Please note that the 360° Virtual Advisor Pole Position model portfolio is currently 50% net long. Holdings are LMT, FXI, FB, FNV and EUO. The remaining 50% of the portfolio is held in cash.
The author does not hold a position in any of the mentioned securities at the time of publication. Any opinions expressed herein are solely those of the author, and do not in any way represent the views or opinions of any other person or entity.
 Flirting With Critical Support… Again")


