The once left for dead Biotech Sector has re-awakened. The group is experiencing some of the same ‘this is it, it’s over’ sentiment that the U.S stock market has faced for the last 3 years. Biotech stocks have been lagging the markets and its popular sector ETF, Biotech iShares (IBB), is at a crucial price and relative strength level.
At the same time, it’s rallying and retracing some of those losses. To get a better idea of what’s going on, let’s take a look at a daily chart of the price action.
Biotech iShares ETF (IBB) Chart
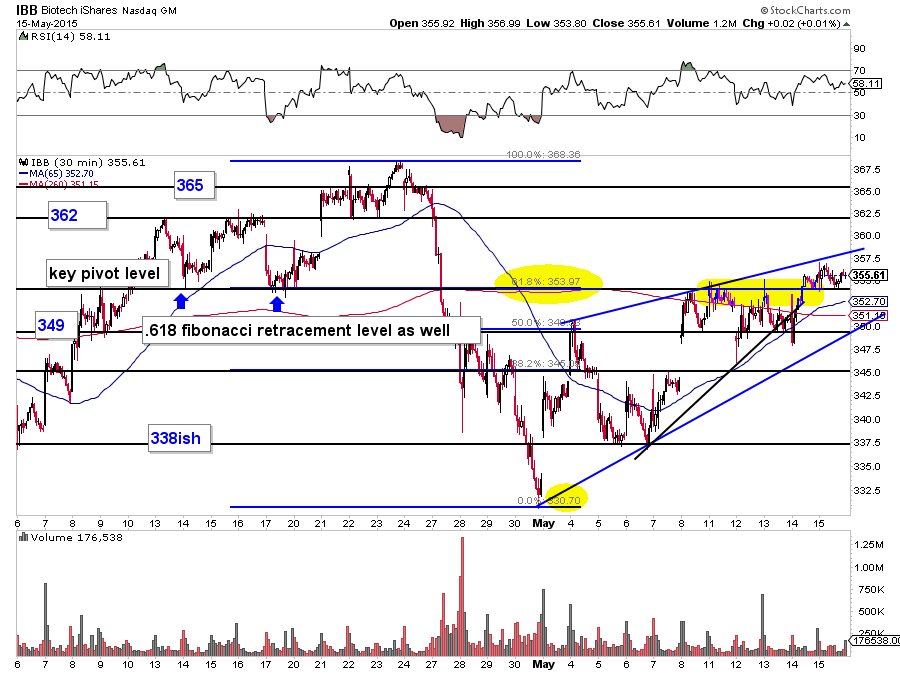
There is a lot going on here so let me know walk through some key takeaways from the chart above:
- The Biotech Sector ETF has tested and recently broken above the .618 fibonacci retracement level. This level is also a key price pivot level.
- There is room to run up around 358 within the rising wedge. About that could bring 362 (the next meaningful pivot).
- 349 was reaffirmed as support last Thursday.
- 337-338 is a crucial pivot area lower.
The next chart looks at the relative strength of the Biotech Sector based on IBB’s performance compared to the S&P 500 ETF (SPY). Relative strength is seeing some feisty action at the 20 and 50 day moving average combo area. How this nets out in the days ahead may be important.
IBB:SPY Relative Strength Ratio Chart
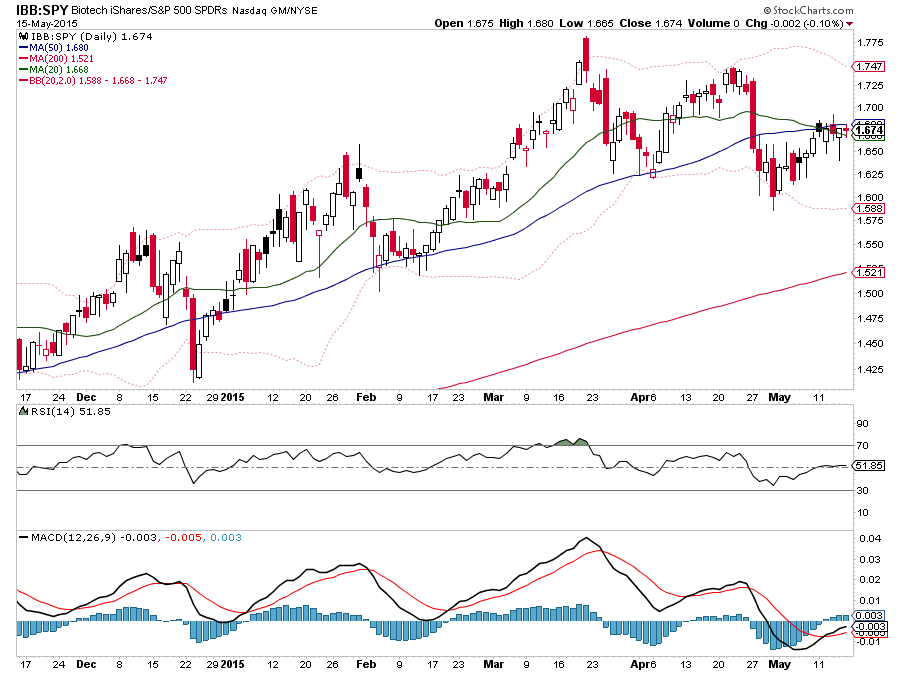
The next few days might give us some meaningful hints about the intermediate future of biotech stocks. Will the leadership re-emerge? Time will tell!
Further Reading: other SIM biotech posts.
Thanks for reading!
Follow Aaron on Twitter: @ATMcharts
No position in any of the mentioned securities at the time of publication. Any opinions expressed herein are solely those of the author, and do not in any way represent the views or opinions of any other person or entity.


