This past week, silver, gold, and gold miners all rallied,
So did oil and sugar.
DBA, the agricultural ETF, made new all-time highs.
The water ETF PHO consolidated near the all-time highs.
In our “how do we see if inflation is picking up” analysis, we started to see some of the signs.
- Oil over $80
- Silver picking up against gold
- Gold miners finding support
- Sugar back over 22 cents a pound
- Soft commodities like cocoa flying
The question that keeps coming up is, what is next?
Will the Fed cut rates?
Will inflation pick up and force the Fed to raise rates?
Is this the start of a second wave of inflation?
Or is it more like stagflation?
Is recession off the table?
Is this a “no landing” scenario.
During conversation with Kitco News, we came up with how to view gold miners and silver for clues.
After all, silver over $25 is bullish but maybe not bullish enough.
And miners are bottoming, but that is very different than outperforming.
While gold holds well over $2100, we must wonder what is next for the metals and inflation.
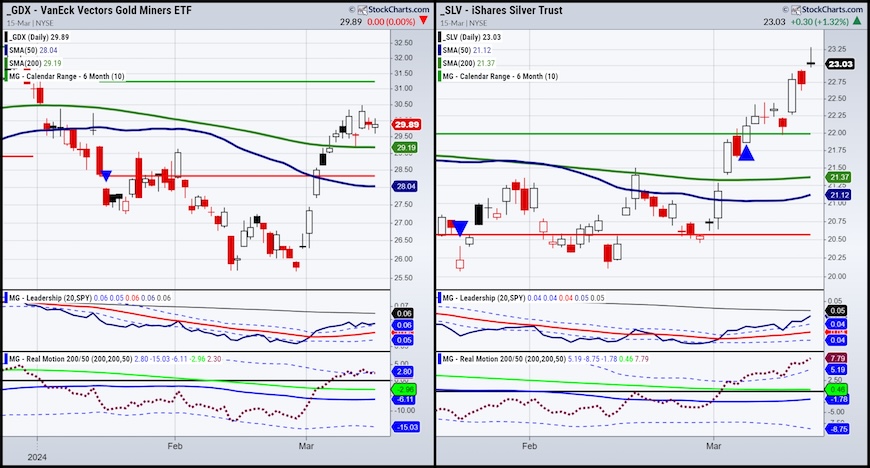
Interestingly, GDX has a positive trend strength indicator reading. However, it is ranked 14 in our Sector Moderate Quant Model ranking.
On the chart, GDX is trading above the 50 and 200-DMAs. The phase is accumulation.
It is outperforming the SPY on our Leadership indicator.
The momentum gauge shows a slight sell mean reversion.
The January 6-month calendar range high is most compelling. A move above (31.24) or above the January high puts GDX on a new yearly high if happens.
We believe that a move above that level will correspond with gold over $2200 and silver above $26.
That in turn, should bring in panic buyers.
The silver chart looks even better.
As we prefer to use the underlying future for the metal’s ETFs since its peak in 2021, silver has seen every rally’s high lower than the previous rally’s high.
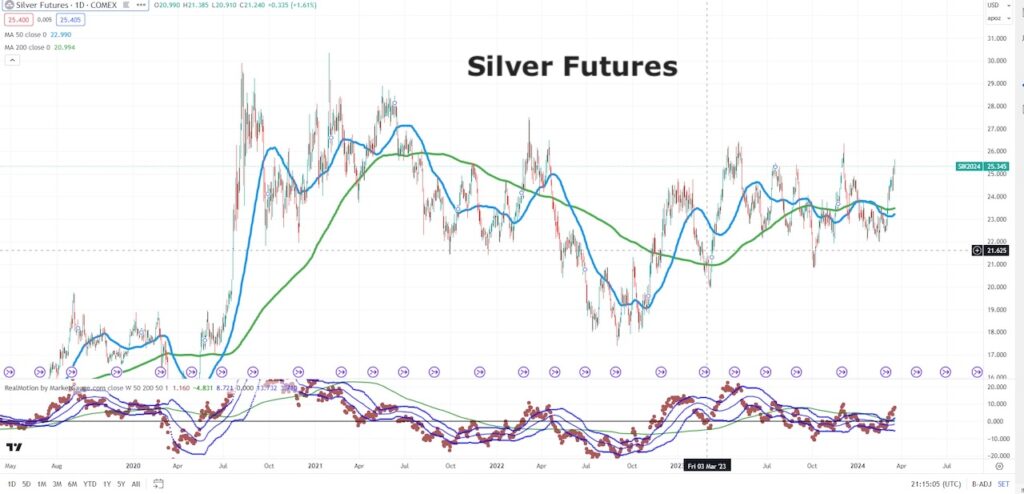
To break that pattern of lower highs, a move above $26.34 should do it.
Couple that with miners clearing 31.24, gold clearing $2200, heck let’s throw in there, sugar over 23 cents, and we got ourselves some real inflationary indicators to sink our teeth into.
We also imagine that investors ignoring the metals will begin to pile in for a potential parabolic move up.
This coming week, we will know rather quickly.
Should investors rotate into commodities?
Remember this.
Silver in 1980 traded at $50 an ounce. The Dow traded at $1000.
Today, silver is ½ of the 1980 price while the Dow is nearly 40 times higher.
Opportunity?
I would not ignore the setups.
Twitter: @marketminute
The author may have a position in mentioned securities at the time of publication. Any opinions expressed herein are solely those of the author and do not represent the views or opinions of any other person or entity.

: Worrisome to Broader Market?")

