Were you ever told, “Buy Low, Sell High?” That was one of the first market maxims I learned early on in my career as the tech bubble burst.
Unfortunately for many investors at the timing, buying low was not a great approach as weaker charts tended to get weaker for years to come, particularly in the technology space.
While that sort of mean reversion pattern can certainly happen on short-term and very long-term time frames, for most investors it should be more about “buy strength” than “buy low”. By focusing on areas of the market showing technical strength, you can benefit from what’s called the “momentum factor” where strength tends to beget further strength.
In today’s video, we’ll share two technical analysis charts- DISH and STLD- and show why focusing on strength is often the most important aspect to chart analysis. (see charts further below)
- What are the characteristics of strong charts, in terms of price, momentum and relative strength?
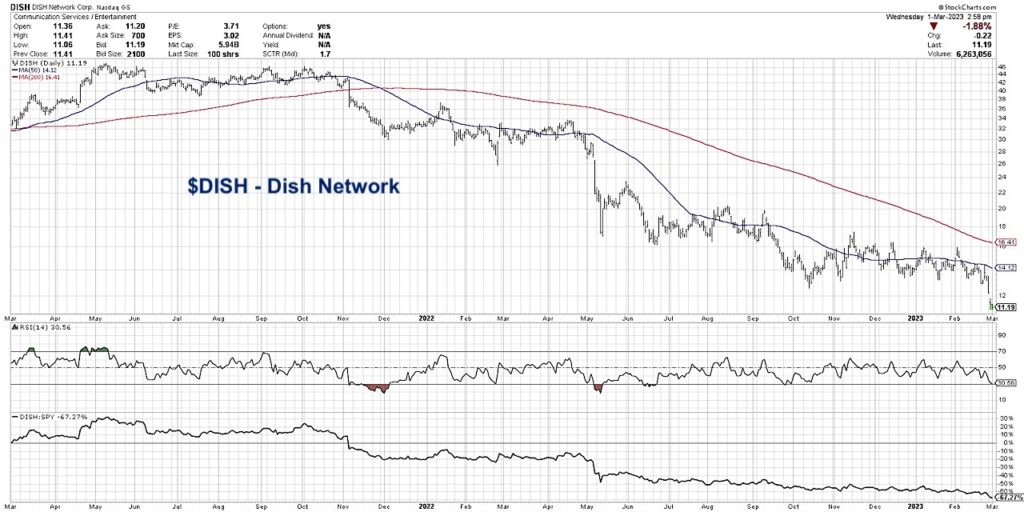
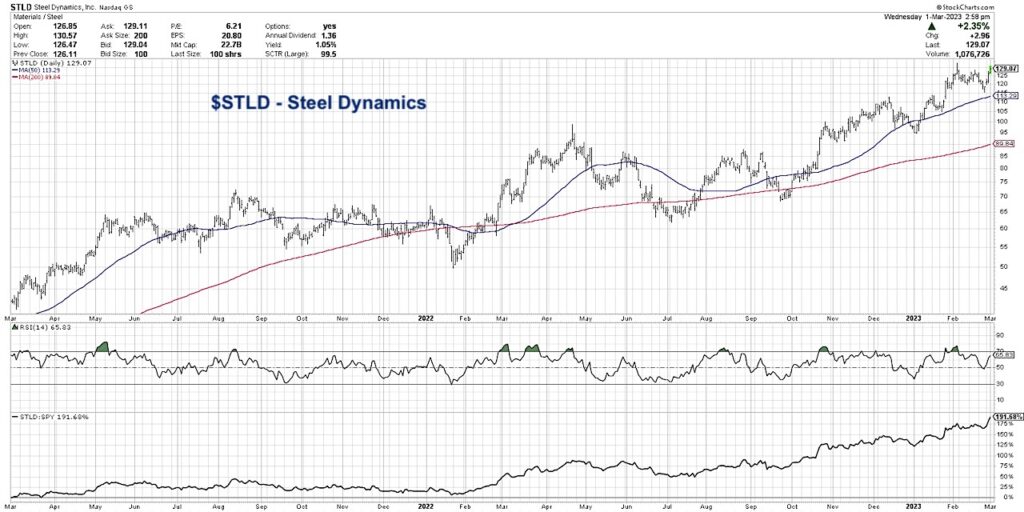
- What can we determine by analyzing the price trends of downtrending names like DISH and strong uptrending names like STLD?
- How can we use technical analysis to determine when a chart clearly rotates from a period of strength to a new phase of weakness?
[Video] Using Strength To Pick Winning Trades
$DISH Chart
$STLD Chart
Twitter: @DKellerCMT
The author may have positions in mentioned securities at the time of publication. Any opinions expressed herein are solely those of the author, and do not in any way represent the views or opinions of any other person or entity.


 Flirting With Critical Support… Again")

