In 2007, the Emerging Markets ETF (EEM) was at all-time highs… a little over a year later and it fell 50 percent.
Fast forward to today, and the $EEM Emerging Markets ETF is trading near all-time highs and looking for a major breakout.
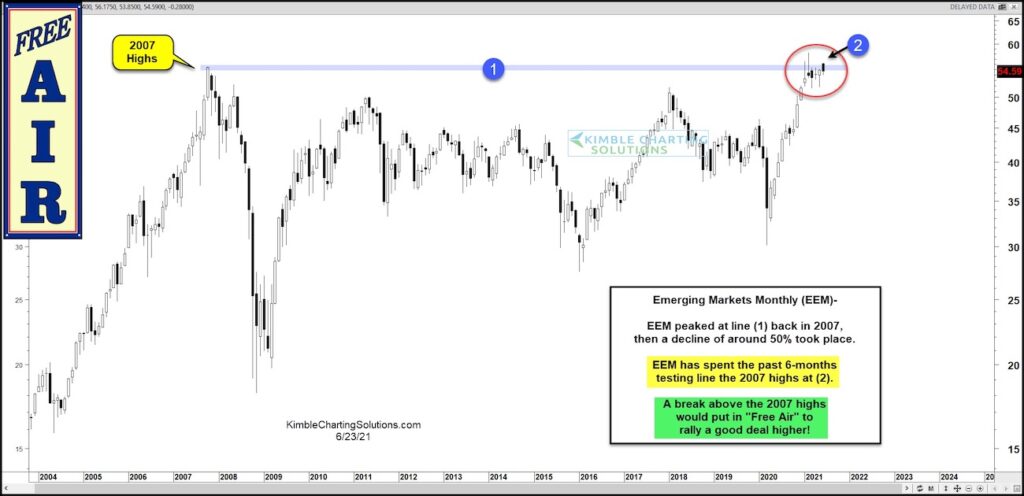
Looking at the “monthly” chart below, you can see the 2007 highs marked by (1). It’s been a wide sideways slog for $EEM, but the ETF is trading up against those highs again and looking to break free and into “free air”.
The monthly chart offers a great deal of perspective. While price has made new all-time highs, the monthly closing price has remained near the 2007 highs (see a couple of wicks that poked above). Bulls really want to see a strong candle with a closing price ABOVE the 2007 highs.
Should $EEM break free of the 2007 resistance at (2), it would likely attract a good deal of buyers. Stay tuned!
$EEM Emerging Markets “Monthly” Chart
Note that KimbleCharting is offering a 2 week Free trial to See It Market readers. Just send me an email to services@kimblechartingsolutions.com for details to get set up.
Twitter: @KimbleCharting
Any opinions expressed herein are solely those of the author, and do not in any way represent the views or opinions of any other person or entity.


