 Well, that’s it for Ben Bernanke’s pseudo-hawkish trial balloon.
With a mostly non-descript June 19th FOMC statement just released, financial markets listened with rapt attention to Bernanke’s Q&A responses in the press conference that followed for any allusion or intimation to tapering of the Fed’s asset purchases.
The Fed Chairman did not disappoint, giving what was immediately and almost universally interpreted as a hawkish turn. US Treasuries (Symbols: ZN, ZB, ZF) sold off hard as did oil (Symbol: CL) and gold (Symbol: GC) among other commodities while the US Dollar (Symbol: DX, USDX) set off on a 14-session, 5% rally; and equities (Symbol: SPX) suffered mightily (which is to say, they went down) in their largest 2-day sell-off of the year.
But all that’s over. At least, it is now for the US Dollar.
Outside the hyper-sensitized post-FOMC context, a glance over that day’s press conference transcript shows that Bernanke had cut a far less hawkish figure than markets and news media had reflexively concluded. Taper trial balloon? Yes, but not nearly so ostentatiously or aggressively as first portrayed.
Stocks sorted this out amidst the dovish narrative revisionism the Fed undertook the following week after witnessing this misapprehension of messaging. 7 weeks later, bond markets – not coincidentally, US Treasuries and MBS most of all – remain incredulous just off their lows. Commodities are something of a mixed bag; and the US Dollar just completed a full round trip back to its pre-FOMC level, shedding the aforementioned 5% over the last 22 sessions. That accomplished, the hot air pumped into the USD by Bernanke’s policy rhetoric has completely dissipated.
The Greenback’s rise-to-fall returns the benchmark currency index to 81 and marks the third support touch in 2013 of the rising trend line off the Spring 2011 lows near 73. The fate of the US Dollar is by no means assured, but with three encounters at support in 7 months following none over the previous 17, it is especially prudent to reassess the Strong USD thesis that has held sway in 2013 year-to-date.
To do that, let’s have a look at the US Dollar Index itself; and then peek in on the 6 individual currencies that make up the index.
US Dollar Index (DX, USDX) – Monthly
The Greenback has been in a sweeping consolidation for the better part of 10 years after positively collapsing from 2000-2004. This narrowing sideways movement has coalesced in the wake of the financial crisis into the symmetrical triangle (blue/purple) depicted below. Looking at the top side, note that two lines – one solid, one dashed – bracket the index with inside (closing) and outside (intra-month high) resistance. On two previous instances in the crisis recovery period, the USD rallied furiously from the mid-70s to nearly 90; and both times a mini-blowoff (to monthly high resistance) was installed that functioned as a bull trap quickly followed with equally forceful declines – declines that began with the top month ending in a close beneath the dashed inside (closing) resistance line. (click image to zoom)
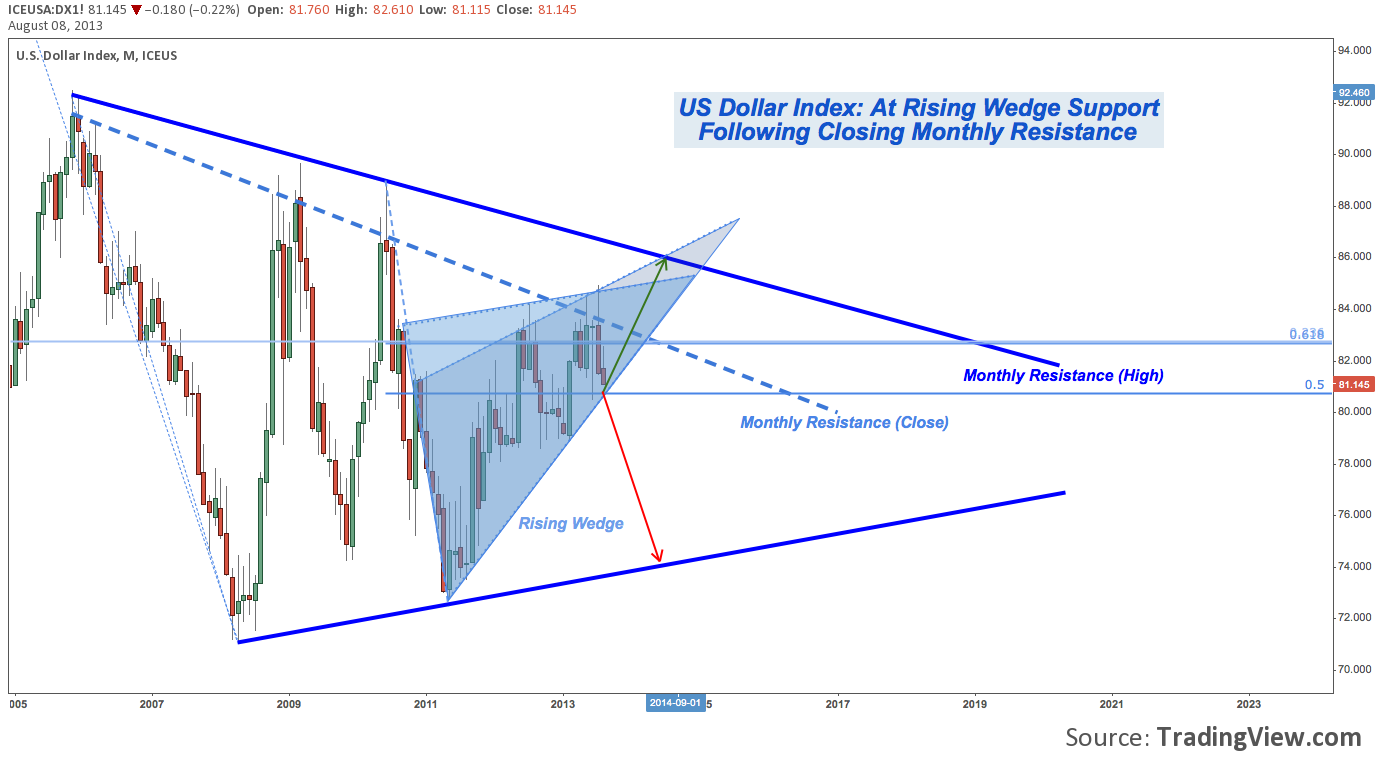
Almost three years later, it looks like the USD may be at it again.
May and July each featured an attempt to break inside resistance, solidly rejected each time. Neither month installed a range that came close to tagging the diverging outside resistance line; but the wick installed on July’s candle is evocative of 2009 and 2010. As mentioned above, since that high was installed near 85, the Greenback lost -5%.
This latest decline brings the USD back to rising wedge support near 81. This instance differs importantly from the other two wedge support touches in 2013: the rising wedge has now advance 2/3 to its apex and is inside it’s prime break window. Similarly, the convergence of the rising wedge with descending inside resistance is effectively forcing the Greenback into a corner. The coil-up will result in a break higher toward outside resistance at 86 to complete the 4th touch there that has been building since early 2011. Or a break down from the wedge through 80.80 will follow with significantly bearish implications.
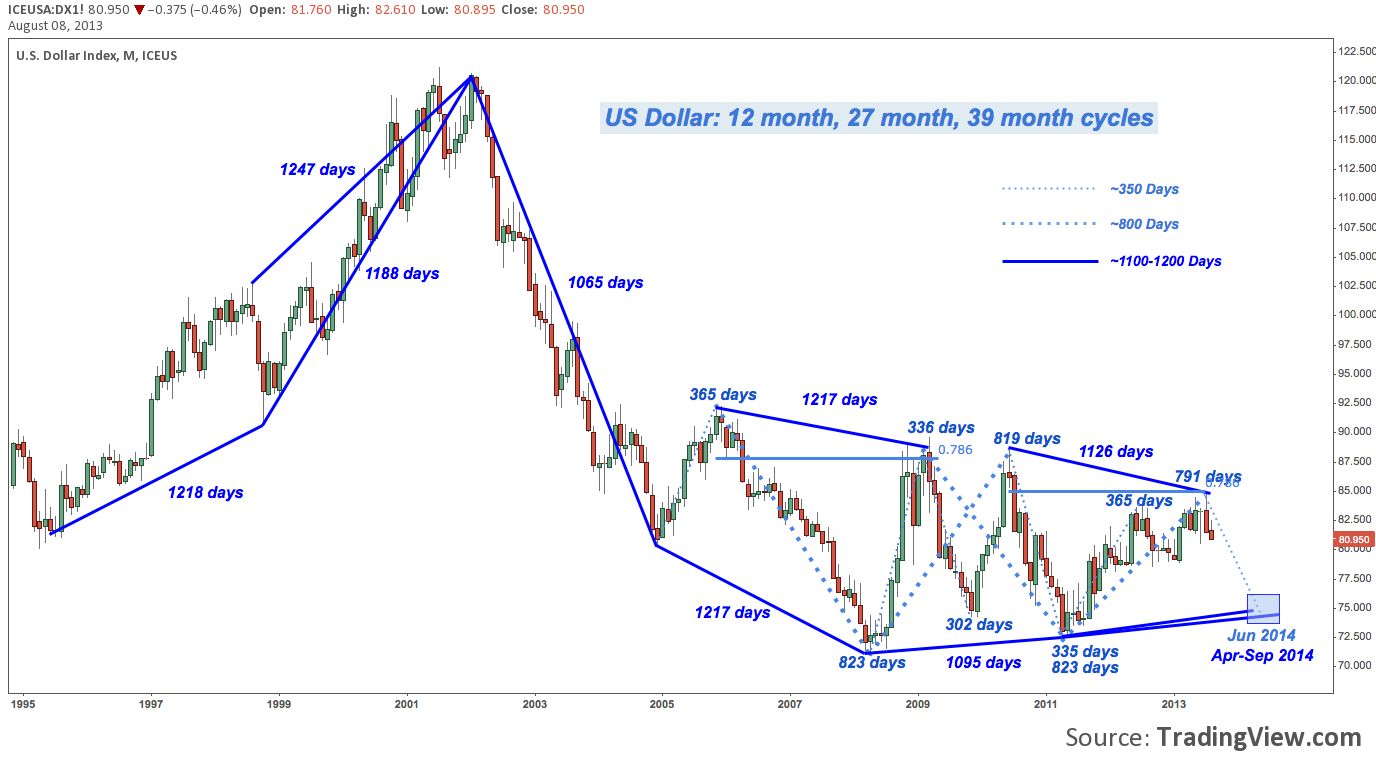
US Dollar Index (DX/USDX) – Monthly (with cycles)
Rudimentary cycle analysis suggests the US Dollar may be due for a correction. For the better part of 20 years, the Greenback has moved through three >1 year cycles. The first cycle – much more consistent and readily apparent since 2005 – lasts 300-350 days. The second, a little over two years and usually envelops two of the smaller cycles. The largest apparent cycle lasts 1050-1250 days (1156 days on average) or 39 months – roughly equal to the duration of three of the smallest cycles. The largest cycles measure between major swing highs and swing lows, resulting in overlapping or concurrently running “low” and “high” cycles.
The latest 27 month (“791 days”) and 39 month (“1126 days”) cycles denoting a local USD top culminated in July. This suggests a decline will follow to complete the next 12 month (from the July 2013 high), 27 month (from the June 2012 high), and 39 month (from the April 2011 low) “low cycle” between April and September 2014. Specifically, the newest 12 month cycle dials in a projected low in June 2014.
Any number of variables can alter these time projections; in this case the past is instructive about an approximate window of time and direction; but it’s important that while cycle analysis extrapolate heavily from the past, they are anything but static processes. (click image to zoom):
Breaking Down the US Dollar Index
Thus far, the medium-term outlook (i.e. the next ~2 years) for the USD seems pessimistic. But what do the US Dollar Index’s (USDX) cross currency constituents have to say?
The USDX is a weighted average of the Greenback’s performance against a basket of 6 individual currencies. The index itself been around since the early Seventies, changing only once to include the Euro after its inauguration in 1999. The Euro figures disproportionately in the USDX calculation at nearly 58%. The Japanese Yen is given second priority at almost 14%; and then the UK’s Pound Sterling at 12%. the Canadian Dollar (CAD), Swedish Krona (SEK) and Swiss Franc (CHF) round out the basket. The succession of charts below follows this weighting rubric, each with brief comment.
Euro/US Dollar (EUR/USD) – Weekly (click image to zoom):
In virtue of its weighting, as goes EUR/USD, so – inversely – goes the USDX. As you might’ve guessed, in tandem with the USDX sell-off, EURUSD has advanced. 5 weeks and 600 pips later, the pair is breaking out of the triangle consolidation underway since November. Just above, 1.34-1.3450 poses a significant cluster resistance level. Over that, the early 2013 1.3710 high (denoted by B, below) appears next on the horizon.
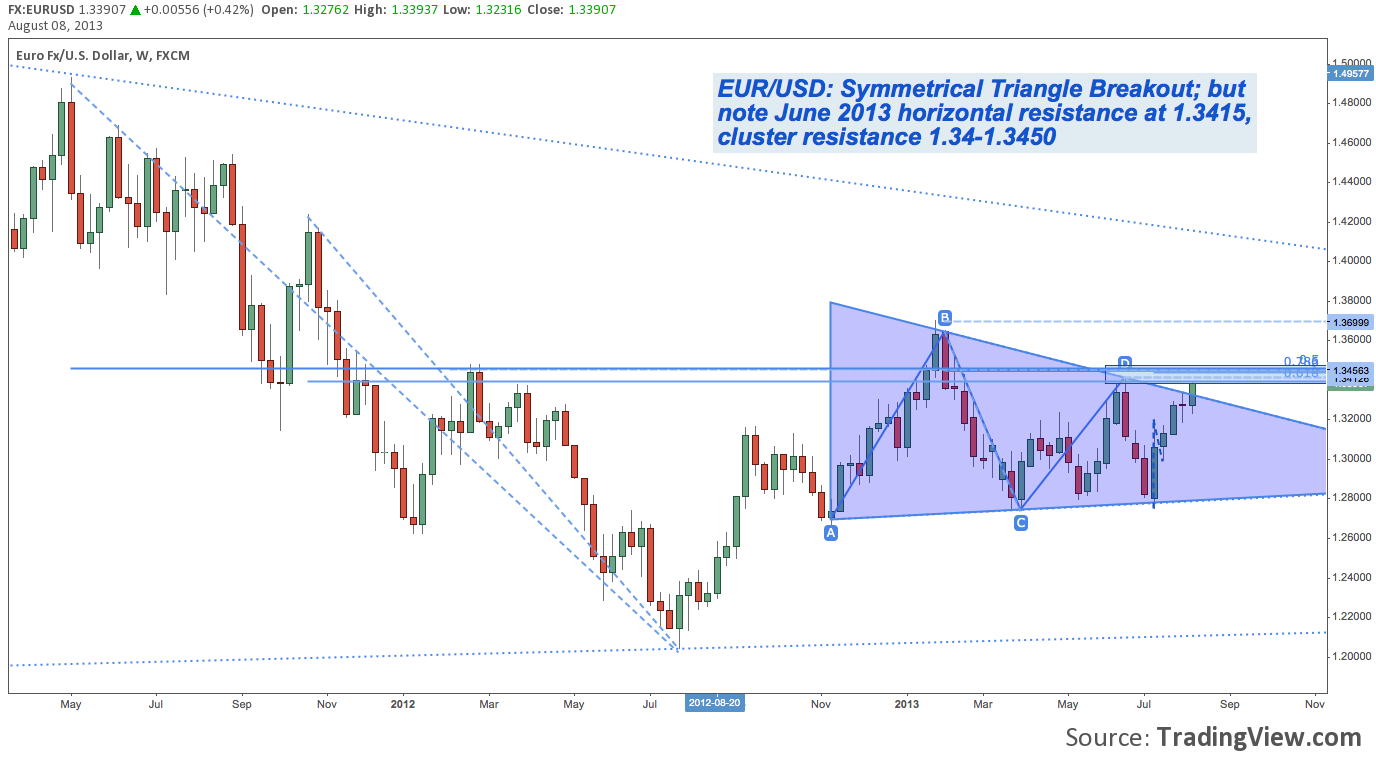
Symmetrical Triangles (almost a descending triangle) are tricky and as a classic pattern are fraught with failure. That aside, the breakout evident here is innocent until proven guilty, and thus USD bearish.
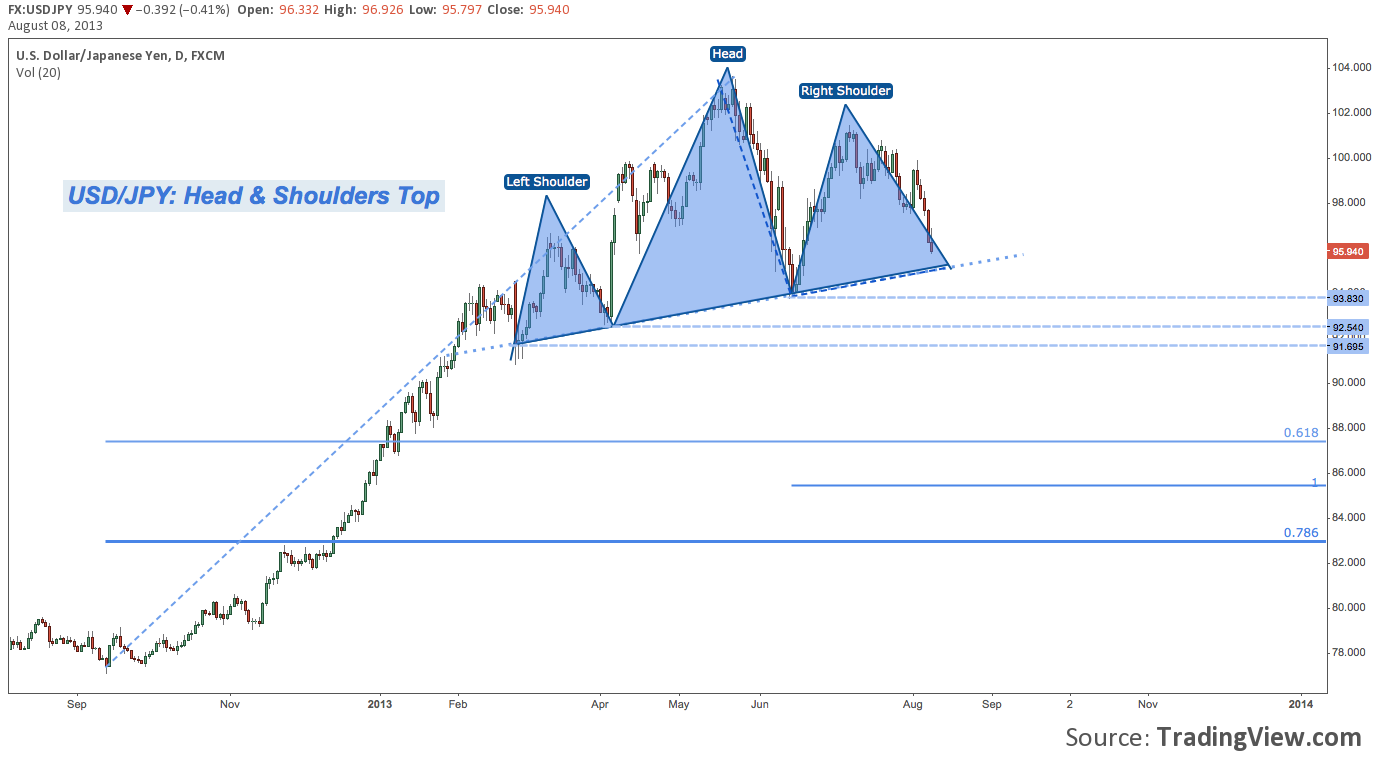
US Dollar/Yen (USD/JPY) – Daily (click image to zoom):
Looking at the USDX second-tier, USD/JPY tells a different tale; but one with a similar outcome. The northeasterly-tilted H&S Top evident on this second-weighted pair is nearing 94 neckline support. Like a triangle, the diagonal trend line that results has numerous failure rungs (dashed light blue horizontal lines). That said: should this pattern activate, it does call for a measured move to 85.50.
Is this possible with the Bank of Japan’s mega-dovish, Yen-debasing market activism? Yes; but skepticism about such an unabashedly JPY-bullish move is warranted. After all, the Fed is testing the tightening waters, while the BoJ just reaffirmed it will proceed in its open-ended trajectory of “unprecedented QE” until 2% inflation is achieved at the current rate of $77B of asset purchases per month. Nevertheless, JPY strength over the past few weeks is evident; and any snap below the H&S Top neckline near 94 should be taken seriously.
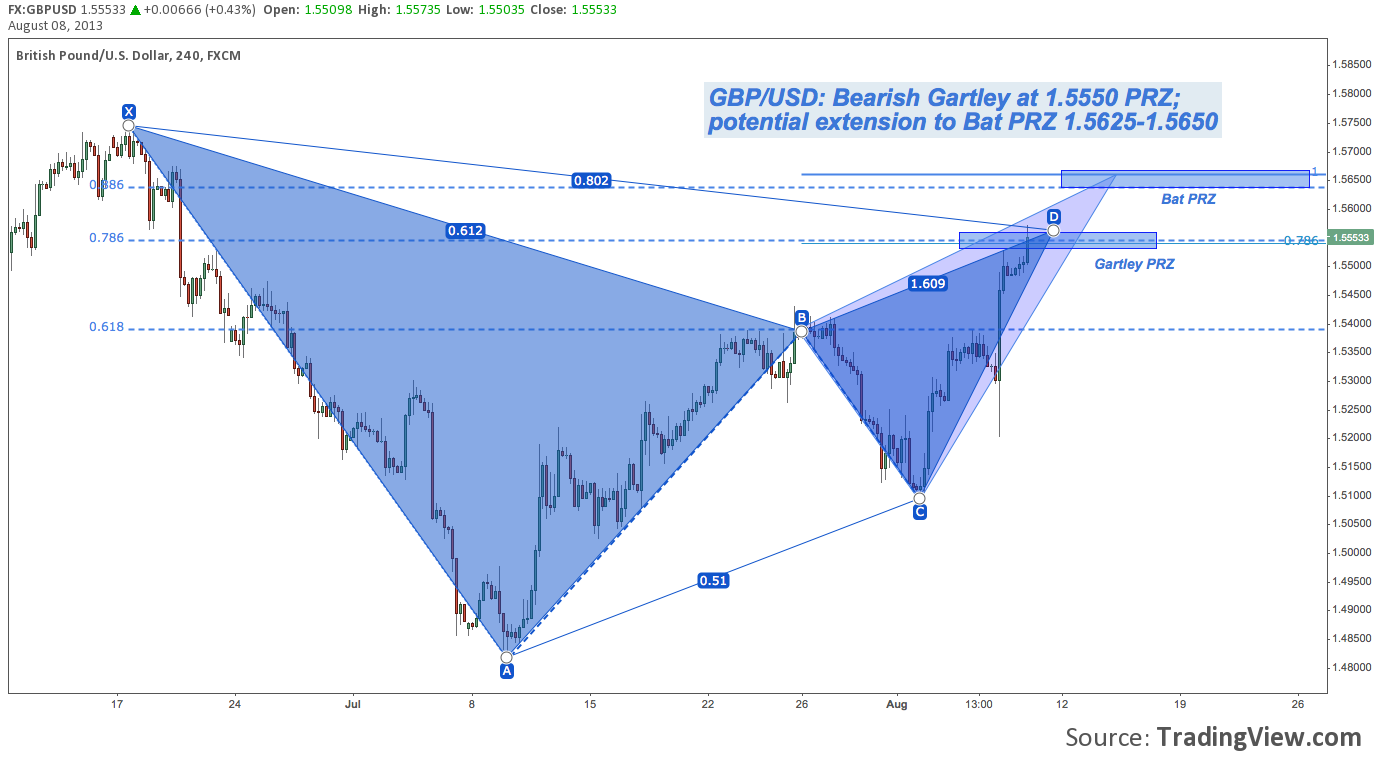
Pound Sterling/US Dollar (GBP/USD) – 4-Hour (click image to zoom):
This is different. There is a bearish Gartley present on Cable suggesting USD strength could emerge at 1.5550; or even (in the case of an alternative draw as a bearish Bat) 1.5650. This is a comparatively smaller pattern and on a smaller TF. Over 1.5750 means Cable has other plans – plans that have nothing to do with a renewal of USD strength.
Now checking in on the third-tier USD constituents:
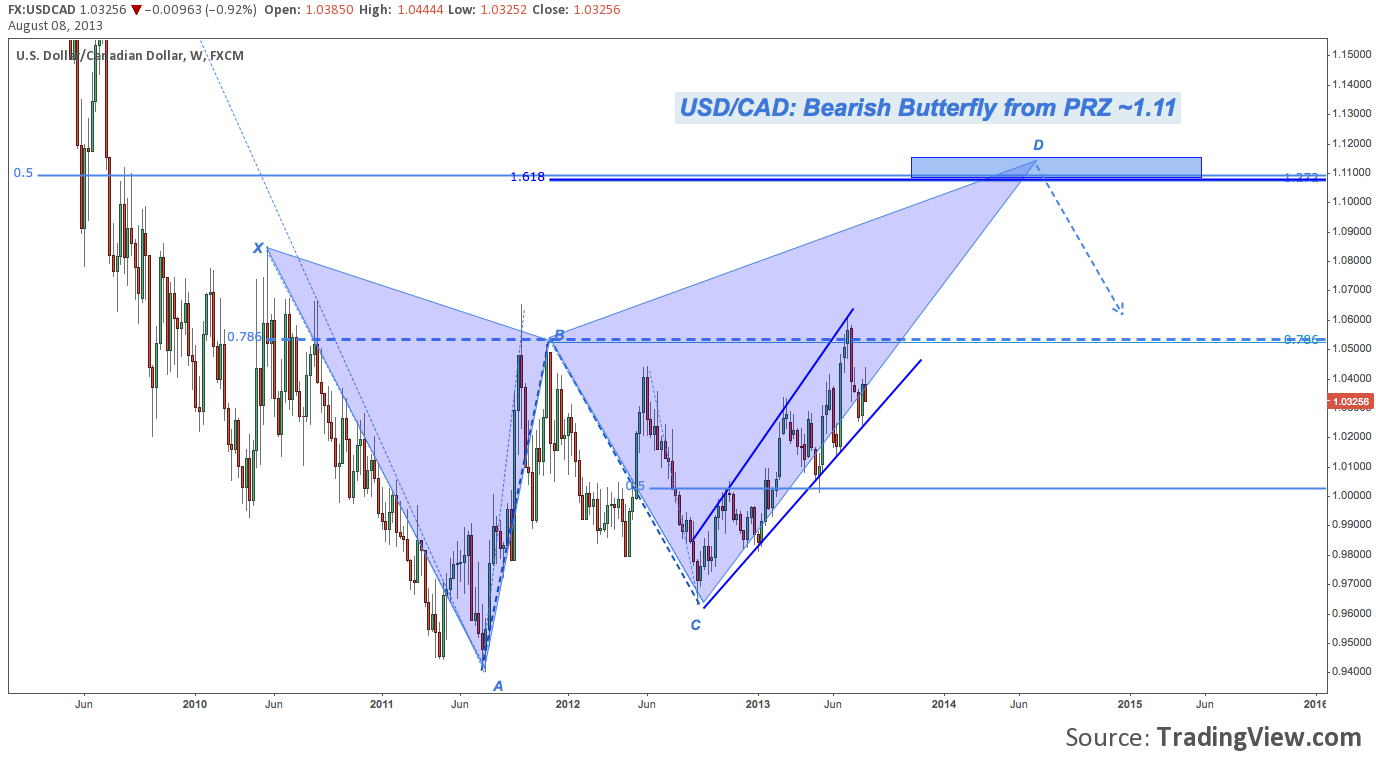
US Dollar/Canadian Dollar (USD/CAD) – Weekly (click image to zoom):
The Loonie features a sprawling bearish butterfly that is impossible to ignore; but not before some significant USD strength carries it from 1.03 and change to the 1.11 potential reversal zone (PRZ) some 8% higher.
On the other, more USD-bearish hand: 1.05 has hemmed in the Greenback for 3 years (mostly recently in June). The bearish alternative inferred form there is a possible breakdown from the ascending broadening formation (began at C) to retest parity and then C between 96-98.
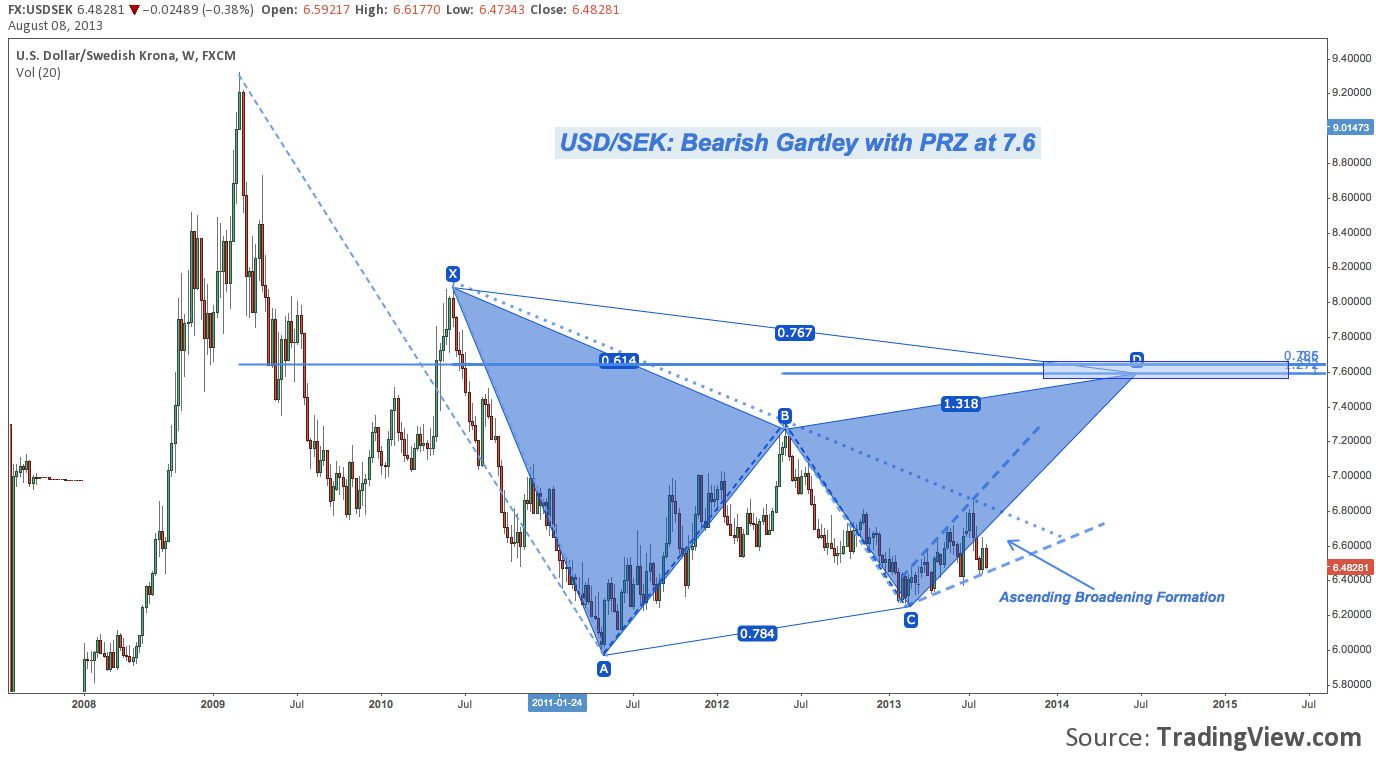
US Dollar/Swedish Krona (USD/SEK) – Weekly (click image to zoom):
The USD has been losing ground against Sweden’s Krona for many years, of which the chart below is but a slice. Like USD/CAD, a bearish harmonic pattern is present on USD/SEK, though getting to the PRZ (in this case, near 7.6) would take considerable USD strength in the medium-term. USD/SEK features an ascending broadening formation also. After being rejected several weeks back at descending trend line resistance near 6.80, the USD is once again under pressure as broadening formation support is retested near 6.40.
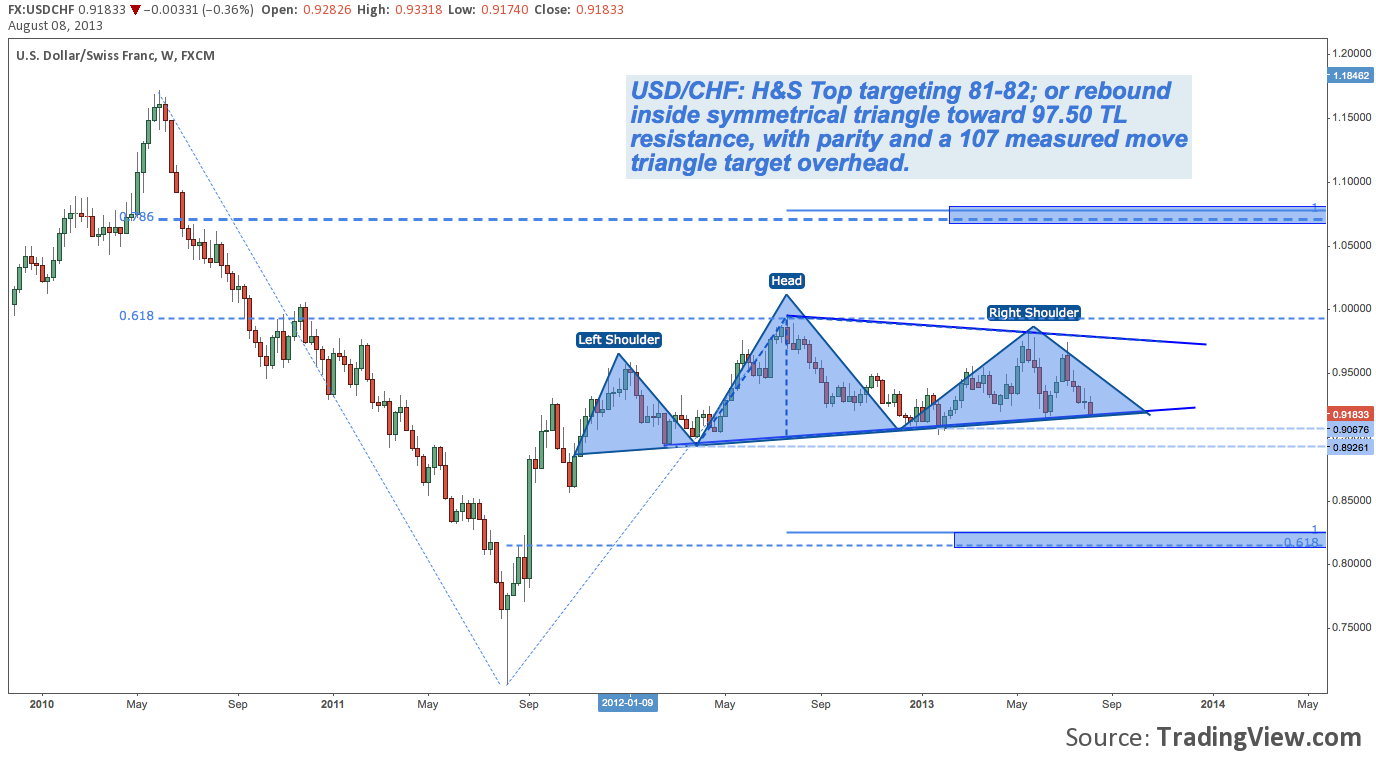
US Dollar/Swiss Franc (USD/CHF) – Weekly (click image to zoom):
Finally, like USD/JPY the Swissie features a H&S top with a diagonal neckline. All the same caveats – e.g. horizontal support rungs given off by the H&S top construction – prevail here as well. A neckline break here opens up a measured move targeting 81, while a move toward trend line resistance sees the next major ceiling at 97.50, followed by parity (where the head was installed in August 2012), and then mostly blue sky until 1.07.
From EUR/USD to USD/CHF, though some short-term upside is on the table, the basket of individual currencies that composes the USDX has very little to recommend the Strong USD thesis in the medium to long-term.
Twitter: @andrewunknown and @seeitmarket
No position in any of the mentioned securities at the time of publication.
Any opinions expressed herein are solely those of the author, and do not in any way represent the views or opinions of any other person or entity.


