Rather than trying to outsmart how the Fed’s policy meetings will affect the markets in the future, why not just let the markets tell you how they feel?
The market’s message isn’t always obvious, and history isn’t perfect guide, but sometimes its patterns are very insightful.
Occasionally, simple patterns in the data might even cause you to discover a perspective that you thought was true, but “just ain’t so” (as Mark Twain once warned).
As Mish mentioned in a recent Daily and as I covered in last week’s Market Outlook, the long bond (TLT) is at a potentially big inflection point.
According to that previous article, if the TLT were to move over 3% in either direction over a 4-8 week period, it could have a real impact on stock prices (see last week’s Market Outlook for details).
Since the TLT is in such an important position, I did some research to see if FOMC meetings have had a noticeable (and thus predictable) impact on market trends.
Here are some interesting insights.
Below, you’ll find a table that shows how the TLT performed on the day prior to the Fed’s FOMC announcement, then on the day of the announcement, the following day, and finally, the following 5 and 30 days.
Note that the green and red shading indicates a move of at least 0.25% up or down, respectively.
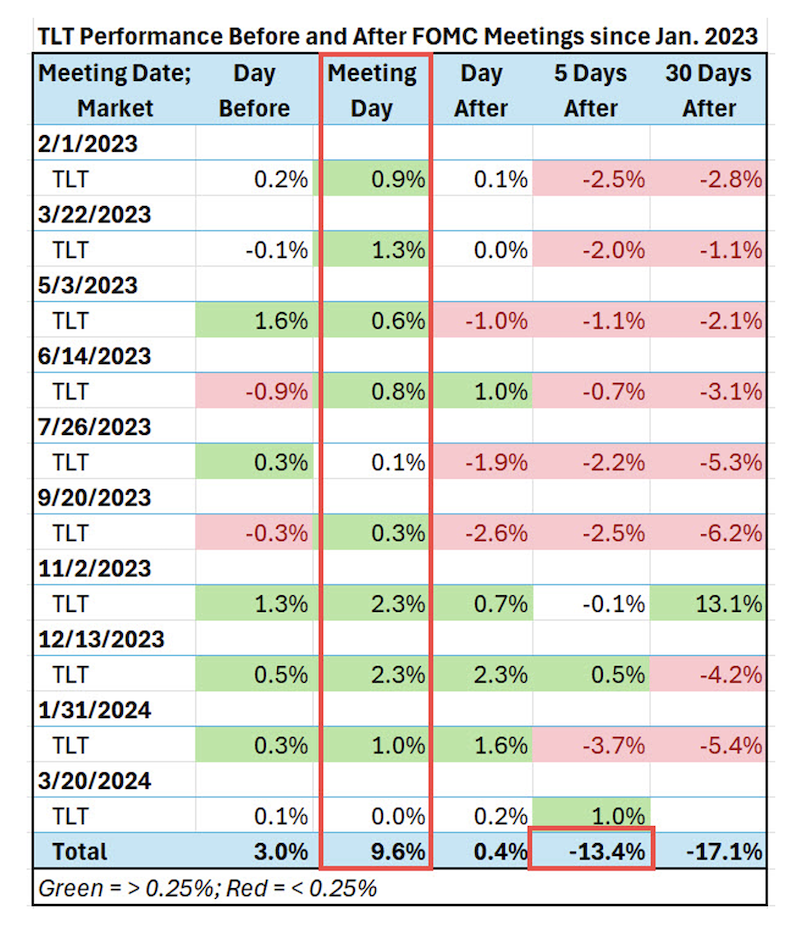
One pattern that jumps out is that the day of the meeting has been bullish or flat (never down) since the beginning of 2023.
However, Fed Chair Powel’s bullish influence fades the following day as demonstrated by the fact that the day’s performance has mixed returns.
By the 5th day after the meeting, the TLT’s have tended to be trading lower than their bullish FOMC day close.
If you look at the last row in the table, labeled “Total,” you’ll see the sum of each period’s performance, which demonstrates that since the start of 2023, TLT has gained 9.6% on Fed announcement days and lost 13.4% in the 5-day period following the announcement.
In fact, the 5 and 30-day periods following the meeting have been bearish.
Below you’ll find the same table for the S&P 500 (SPY).
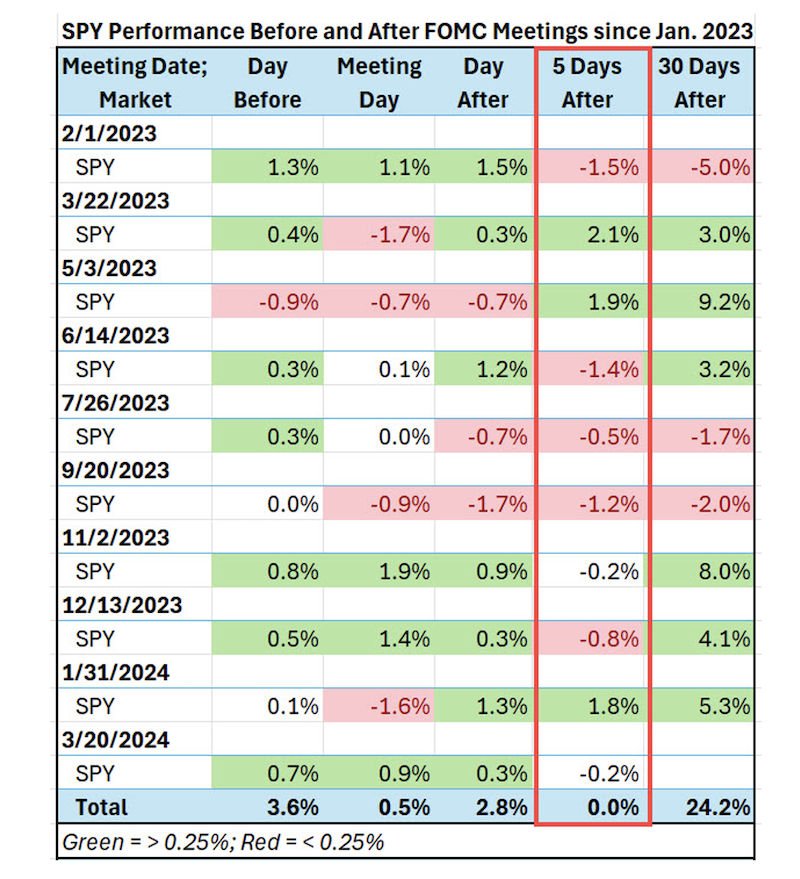
One pattern that jumps out in the SPY data is that the bull market in stocks has not made any progress in the 5-day period following the FOMC meetings.
This isn’t surprising considering the weakness in TLT during this period and the focus on interest rates around the FOMC meeting.
However, that same positive correlation between stocks and interest rates has not been as strong over the longer 30-day period. After the 5-day FOMC weakness, stocks have marched higher regardless of TLT’s weakness.
Other factors, such as earnings expectations and AI enthusiasm, could easily explain why stocks would buck a bearish trend in rates.
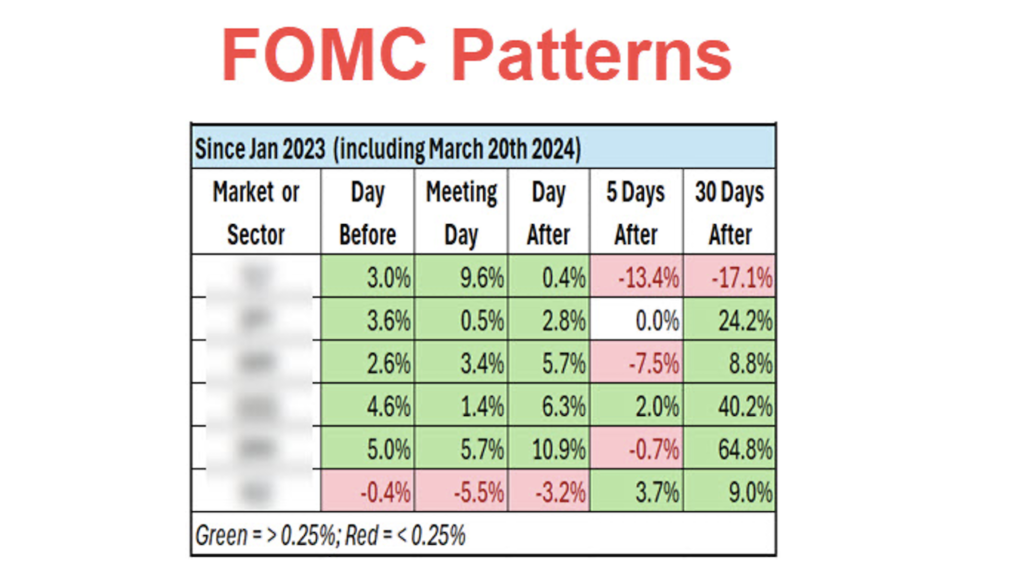
In the tables below, you’ll see the summary data for additional indexes and sectors.
One pattern that stands out in the summary table above is that SMH has shown some weakness in the 5 days following Fed meetings, but it’s also been the best performer in every other time frame other than one – Meeting Day, which is clearly won by TLT.
What you can’t see in the data I’ve shared here is that when SMH has been strong, SPY and QQQ have overcome bearish sentiment from weakness in TLT.
In summary, if SMH and TLT are going in the same direction, don’t fight it.
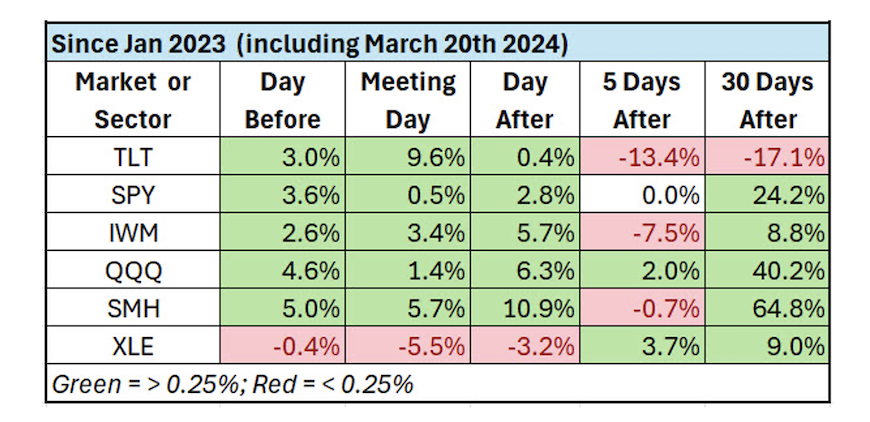
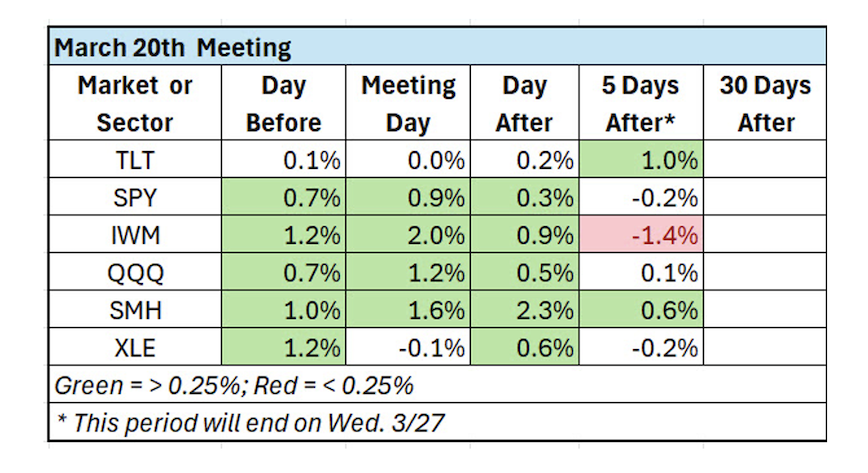
Finally, you’ll notice that I’ve also included XLE, the energy ETF, in the table above and below. As you can see from the table above, XLE has had a bearish trend around the meeting dates over the last year.
However, as you’ll see in the table below, which shows the performance of all of the same indexes and sector ETFs for last week’s Fed meeting, XLE had a relatively bullish reaction to the last meeting so far.
Is the XLE performance an indication that its recent strength is a trend that will continue?
We’ll certainly be keeping an eye on it.
Considering all the perspectives on the patterns discussed up to this point, there are some noteworthy patterns from last week’s Fed meeting.
1. The TLT’s movement was the most muted (least volatile) of any meeting in the last year.
2. Energy was more bullish than it has been over the last year.
3. SPY, QQQ, and IWM didn’t do anything unusual relative to their trading patterns around FOMC days over the last year.
Be aware…
The beginning of the upcoming week is part of the weak 5-day post-FOMC meeting period. It could present some good trading opportunities.Be cautious if TLT and SMH slide substantially and in tandem.
This article was written with Geoff Bysshe of MarketGauge.
Twitter: @marketminute
The author may have a position in mentioned securities at the time of publication. Any opinions expressed herein are solely those of the author and do not represent the views or opinions of any other person or entity.


