Bitcoin prices are pulling back in January following an historic run last year.
Clearly smart money has been taking some gains as the red hot Cryptocurrency takes a breather and retail investors find their way in. Since peaking in mid-December, Bitcoin is down over forty percent. And volatility has picked up.
The big question now is: At what price will Bitcoin find support?
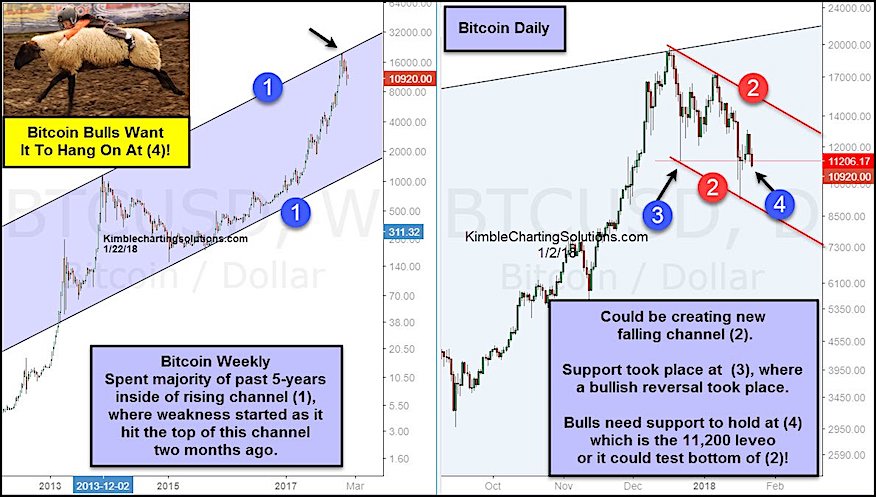
In the image below, you will find two charts. The chart on the left highlights the long term up-trend channel for bitcoin, while the chart on the right shows the recent correction.
In the long-term chart, you can see that Bitcoin is correcting off its upper channel resistance… and it has some room to correct further if it wants (due to its steep run higher).
In the short-term chart, you can see the downtrend channel (point 2) for the price correction. Bitcoin is testing lateral support created by points 3 and 4. A hold here would provide a base for bitcoin to move higher, while a break of support would open the door for a quick move down to channel support around 8000 to 8500.
Thanks for reading.
ALSO READ: Bitcoin 2018 Outlook with Key Price Pivots
Twitter: @KimbleCharting
Any opinions expressed herein are solely those of the author, and do not in any way represent the views or opinions of any other person or entity.


 Ready To Break Out?")


 Rolling Over At Key Fibonacci Level?")
