Bitcoin chatter is rising again. With new ETFs coming to market, crypto investors are getting very bullish.
Is this a good thing? Or is too much bullishness about to send Bitcoin spiraling?
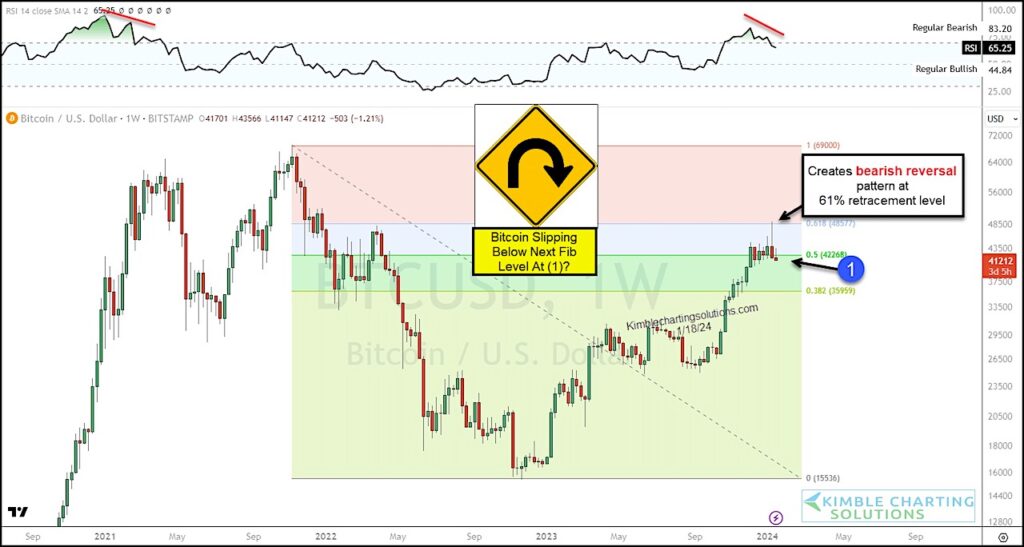
Today we look at a long-term “weekly” chart with Fibonacci levels to show why bears may be circling Bitcoin right now.
Last week, Bitcoin created a bearish reversal at its 61% Fibonacci retracement level. And continued weakness is taking place this week… there’s a potential that Bitcoin will break below its 50% Fib level at (1).
It’s also worth noting the RSI divergence in the top pane.
Looks like Bitcoin may be attempting a trading u-turn of sorts here. Stay tuned!
Bitcoin “weekly” Chart
Note that KimbleCharting is offering a 2 week Free trial to See It Market readers. Just send me an email to services@kimblechartingsolutions.com for details to get set up.
Twitter: @KimbleCharting
The author may have a position in mentioned securities. Any opinions expressed herein are solely those of the author, and do not in any way represent the views or opinions of any other person or entity.

: Worrisome to Broader Market?")


