Bitcoin has been all the rage in the financial markets lately. After it surpassed 50000, headline after headline has come out about it making new all-time highs.
Well it finally happened. And Bitcoin’s price has retreated a little since.
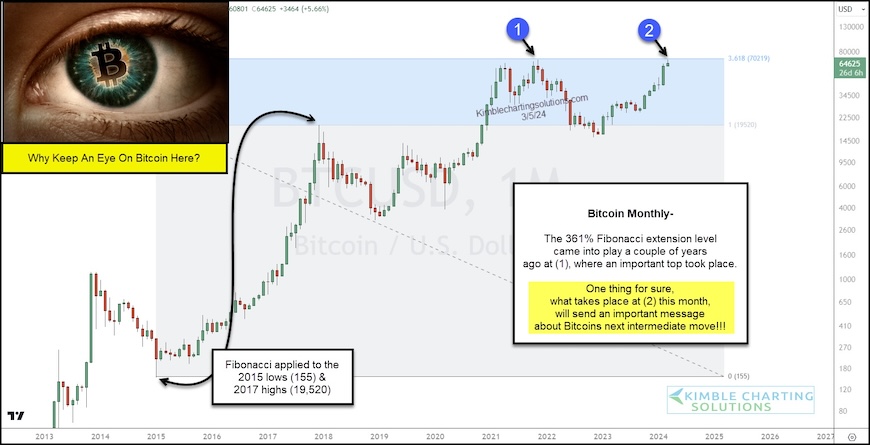
As you can see on today’s “monthly” chart, Bitcoin is basically trading at the highs that formed two years ago – see points (1) and (2). But, more importantly, Bitcoin is trading at its 161% Fibonacci price extension level. This resistance level stopped the last rally at (1)… will it stop (or stall) this rally at (2)?
One thing is for sure: What happens next at (2) is worth keeping a close eye on!!!
Could this Fibonacci price level turn back yet another bitcoin rally? Stay tuned!
Bitcoin “monthly” Price Chart
Note that KimbleCharting is offering a 2 week Free trial to See It Market readers. Just send me an email to services@kimblechartingsolutions.com for details to get set up.
Twitter: @KimbleCharting
The author may have a position in mentioned securities. Any opinions expressed herein are solely those of the author, and do not in any way represent the views or opinions of any other person or entity.


: Important Breakout Retest")


