The on-going decline in the price of Bitcoin has created major news headlines as the cryptocurrency has fallen 50 percent.
Most crypto investors are asking whether the Bitcoin decline is almost over? And what will happen to the price of Bitcoin in the coming weeks?
Today, we look at Bitcoin money flows (inflows) as well as an Elliott wave analysis to see what’s next. Here is a summary of today’s article on the Bitcoin decline and elliott wave analysis:
– Bitcoin inflows triggers more weakness
– Bitcoin is ending the first leg of an A-B-C correction within Elliott wave (IV).
– Price support resides at 24000, followed by 20000.
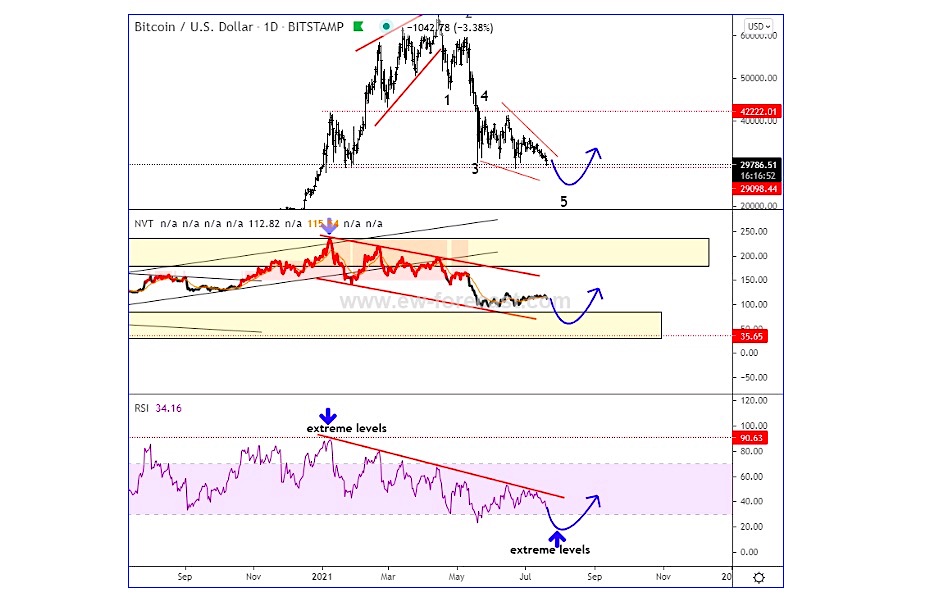
Looking at the daily price chart of Bitcoin (BTCUSD), we can see that the Relative Strength Index (RSI) is still below red trend line, so we may see another drop in the RSI before a reversal. Even NVT is looking for a drop into price support after the recent sideways corrective movement. So, watch out for that decline, as it will probably be the last one before BTCUSD finds a temporary bottom.
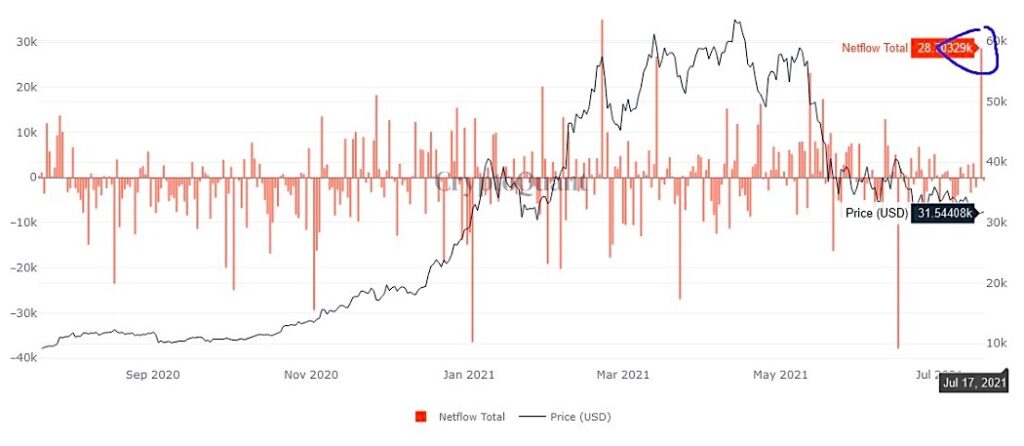
What we also noticed recently is that there were a lot of Bitcoin in-flows recently, which makes you wonder why? It may sound bullish, but its not. “It’s like bringing a car into a car-shop; you obviously have a different idea-exchange it for something else.” It can be one of the reasons why BTCUSD can see a final dip, maybe even on big volume which was often the case on cryptocurrencies before the market stabilized. This is a similar personality with downtrends on stocks.
Bitcoin inflows
From an Elliott Wave approach, Bitcoin (BTCUSD) turned down exactly from projected resistance area back in April when we spotted a top with an ending diagonal that completed wave V of (III). So far we see a nice turn down into wave (IV) correction, which will obviously take even more time to unfold as we see five waves down from the highs as part of the first leg, wave A. So, after a corrective recovery in wave B, that can occur anytime soon, we will have to be aware of another sell-off for wave C to complete a three-wave A-B-C correction .
Bitcoin Daily Elliott Wave Analysis Chart
Twitter: @GregaHorvatFX
The authors may have a position in the mentioned securities at the time of publication. Any opinions expressed herein are solely those of the author, and do not in any way represent the views or opinions of any other person or entity.


 Ready To Break Out?")


