Now that Bitcoin has had a month to consolidate a bit it appears to be poised for a breakout to new highs.
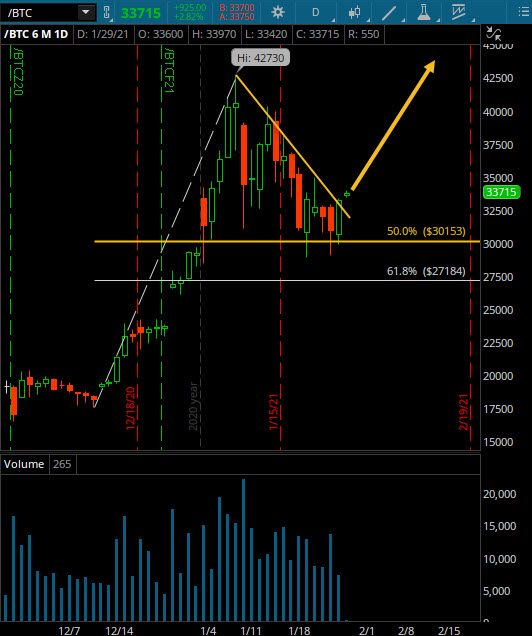
The chart below highlights the classic bull flag pattern (also known as a pennant or triangle breakout) that has shaped up nicely.
The horizontal support just under $30,000 is shaped by multiple touches and rallies off that level; it is most visible by the bottoming tails in the daily candles. At the same time, Bitcoin made lower highs on its pullback depicted by the yellow down-trend line. As you can see in the diagram this is a classic lesson of support and resistance. This type of pattern gets me excited since I have a long-term position in Bitcoin.
The break point would be a move above the swing high of $35,000 which should be enough to send Bitcoin to new highs of $50,000 (projecting out via the -23% Fib retracement) should it stick.
On a breakout move such as this, all pullbacks would be buyable and should accelerate on the way up. I wouldn’t be able to call myself a trader though if I did not specify a failure point. A move below $27,000 would likely send Bitcoin down to the low 20’s, something I wouldn’t be opposed to, but given the amount of institutional buying as of late, it’s not a highly probable scenario.
Bitcoin’s Recent Breakout – Chart Patterns
Twitter: @EminiMind
The author has a position in mentioned securities at the time of publication. Any opinions expressed herein are solely those of the author, and do not in any way represent the views or opinions of any other person or entity.

: Worrisome to Broader Market?")

