“The broader the base, the higher in space.”
It may have been one of my mentors, Ralph Acampora, who first shared that market maxim with me. Or perhaps legendary technical analyst Alan Shaw?
Regardless of where I first heard that sentence, I have often come back to the idea of measuring the height of a pattern and using that range to anticipate potential upside for breakouts.
As Bitcoin tests the “ultimate resistance” level of 20,000 and threatens all-time highs, the question of next steps becomes critical. How high can Bitcoin reach, assuming we get a Bitcoin breakout?
Here we’ll talk about why 20,000 is such an important price level, and then use two different measuring techniques to identify a minimum upside objective for a Bitcoin breakout.
Why is 20,000 so important?
I’ve written before about why stocks and other assets tend to find support and resistance at big round numbers. There is actual academic research demonstrating how prices literally gravitate to big round numbers, perhaps because that is where traders will often set limits and stops.
I tend to go with a more anecdotal explanation. When a stock goes up from $98 to $99 then to $100, that’s when investors tend to “take a step back” and decide whether the stock is actually a triple digit stock. Is this stock literally worth more than $100?
If enough investors follow this train of thought and decide it doesn’t deserve a triple digit valuation, this could certainly provide enough of a pullback to confirm the resistance level.
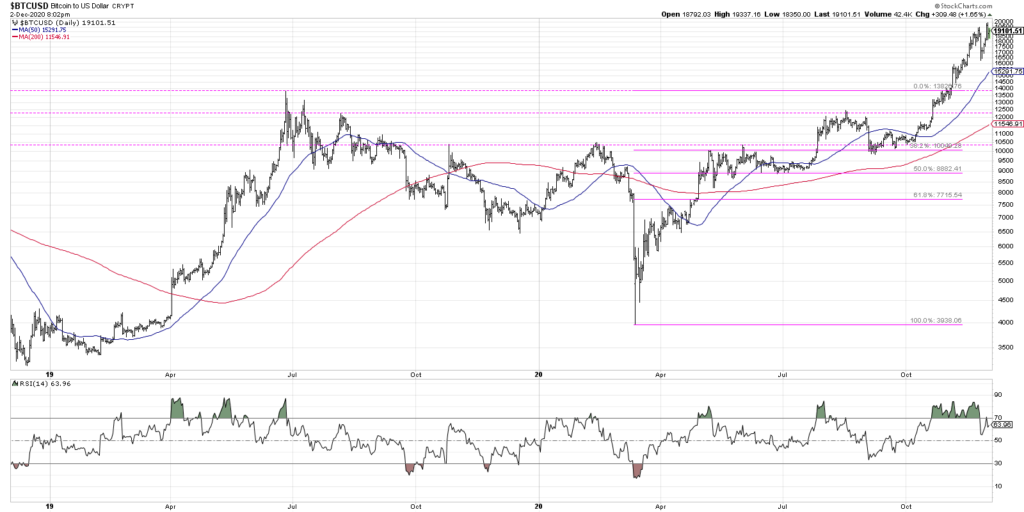
On this particular chart, I’m struck by the symmetry of price movements as well as the significance of support and resistance levels. 10,000 was key resistance in late 2019 and for much of 2020 as well.
Once Bitcoin finally broke above 10,000, it pulled back and retested this level (which was also around 38.2% retracement of the June 2019-March 2020 selloff) from above before resuming its uptrend.
When I see Bitcoin approaching $20,000, I picture someone who bought Bitcoin months, if not years ago, waiting to see if it will ultimately get back to $20,000. Once it finally arrives, there’s the target and that’s where they sell. If enough traders do just that, then the price will revert lower based purely on the selling pressure.
Based on the big round number theory, it’s reasonable to expect that Bitcoin would at the very least back-and-fill just below current levels, as profit taking abounds.
But what if $BTCUSD Bitcoin breaks out above 20K… then what?
This where the opening quote comes into play. The broader the base (that is, the longer the time spent in a particular price range), the higher in space (the further upside to be expected).
If we review the last two years for Bitcoin, we can see the June 2019 high around 14,000, then the subsequent downturn to around 4,000. One simple way to project the upside for Bitcoin (given the breakout above 14,000) is to measure the height of the pattern, about 10,000 points, and add that to the breakout level.
14,000 + 10,000 = 24,000. There’s our minimum upside objective.
But if we look a little further back, we can now see the all-time high in 2017, and the last two years appears to be a rotation within the much larger basing pattern over the last three years.
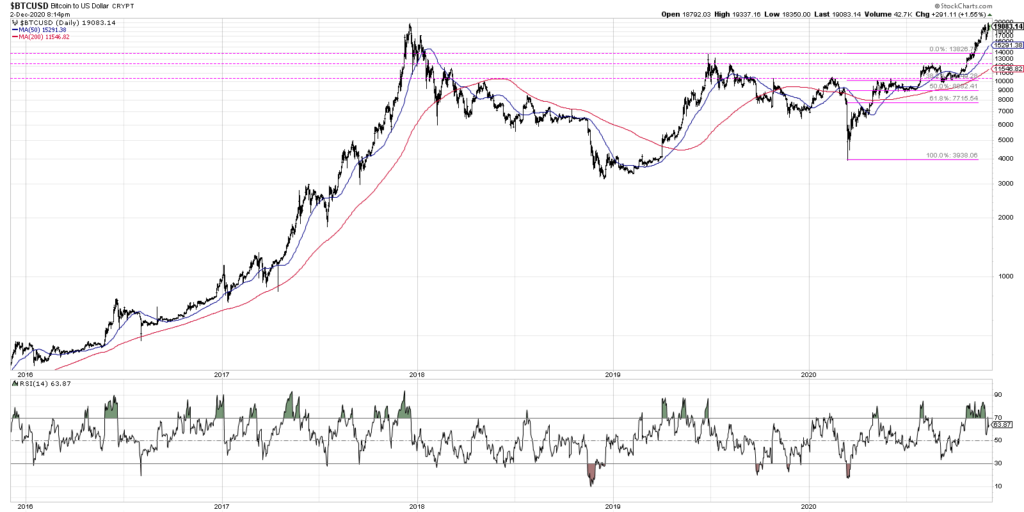
By comparing the 2017 high and the late 2018 low, we see that the base actually has a range of just under 17,000 points.
20,000 + 17,000 = 37,000.
Now bear in mind, this is not a prediction. And it also should not imply that cryptocurrencies are expected to go directly from point A to point B without plenty of volatility and unexpected turns along the way!
What it does suggest is that given the extent of the base, both in time and price, a break above 20,000 would suggest much further potential upside for Bitcoin.
If you think Bitcoin 37,000 sounds absolutely insane, think about what Dow 10,000 or 20,000 or 30,000 sounded like decades ago!
“Never confuse the top of the page with resistance.”
To see this article in video format, check out my YouTube channel!
Twitter: @DKellerCMT
The author may have a position in mentioned securities at the time of publication. Any opinions expressed herein are solely those of the author, and do not in any way represent the views or opinions of any other person or entity.

 Rolling Over At Key Fibonacci Level?")


