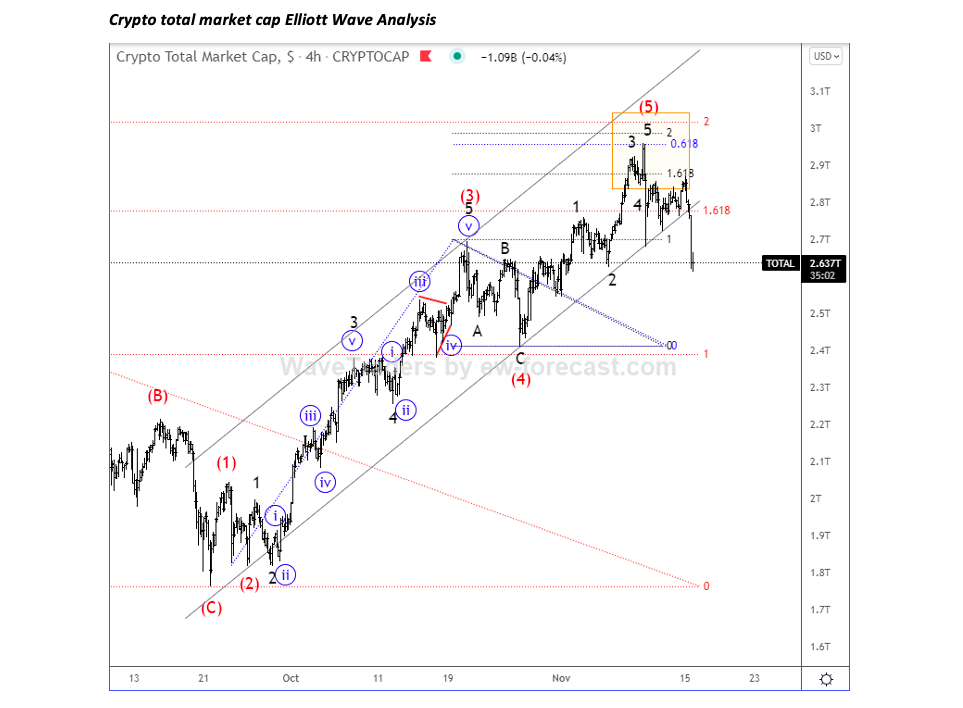
As mentioned and highlighted, Crypto Total Market Cap is now breaking below channel support line after a completed 5th wave of a five-wave cycle exactly at the projected target, so we will have to be very careful. Three down or five down next?
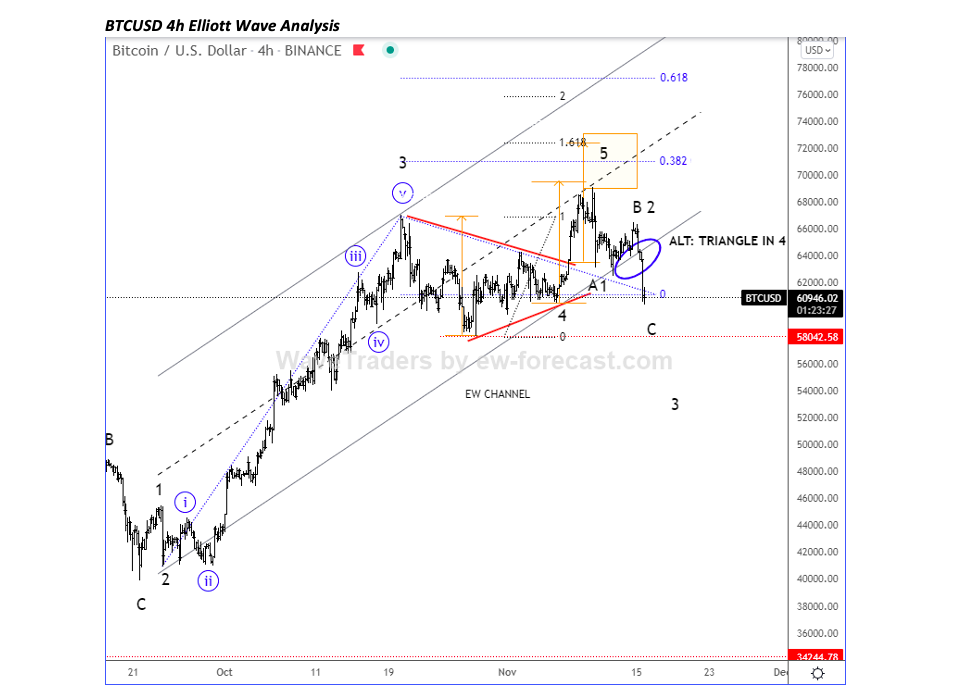
BTCUSD is coming nicely lower and trading around key 60k-58k support zone, but any bigger decline below base channel support line and decisively beneath 58k region, then we will start tracking bearish impulse.
On 4h chart, BTCUSD is breaking below channel support line after we noticed a completed 5th wave, so we are now tracking either wave C or maybe even wave 3. If BTCUSD manages to stay above 58k level, then this could be still wave C, but in case of decisive break below 58k region, then be aware of wave 3 of a five-wave bearish impulse.
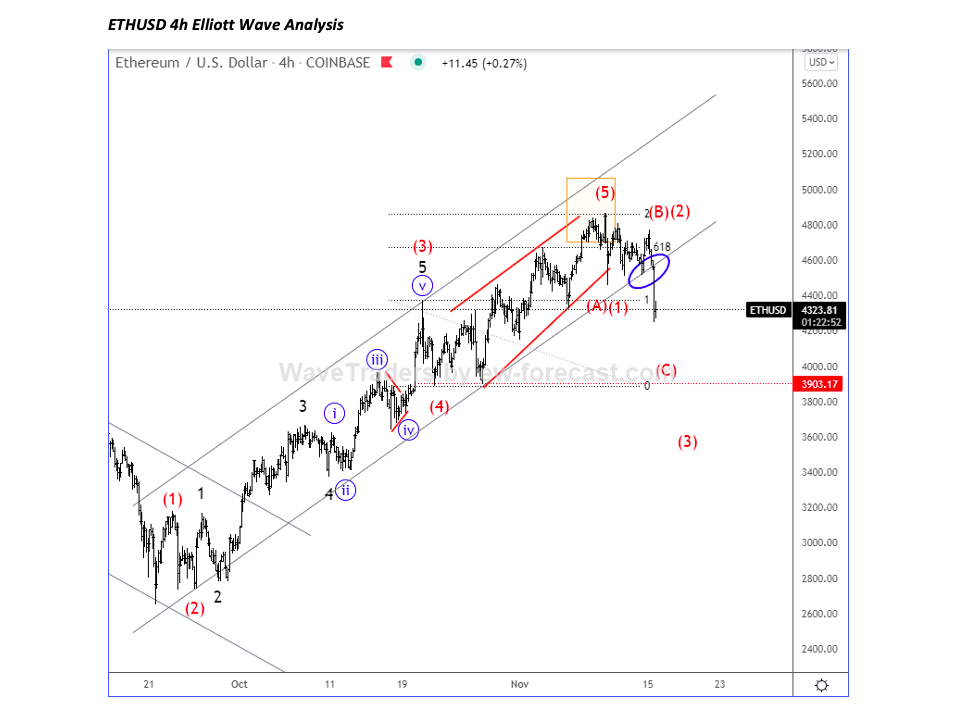
ETHUSD is coming down and we see key do or die support her around 4200-3900 area, however, any bigger drop and decisive break below 3900 region would be a serious signal for bearish cycle from the highs.
On 4h chart, ETHUSD is down after we mentioned and highlighted ending diagonal (wedge) pattern within wave (5). With current break below channel support line, we are now tracking wave (C) with key support around 4000 – 3900 area or maybe even wave (3) if we see a decisive break beneath 3900 region.
Twitter: @GregaHorvatFX
The author may have a position in the mentioned securities at the time of publication. Any opinions expressed herein are solely those of the author, and do not in any way represent the views or opinions of any other person or entity.

: Worrisome to Broader Market?")

