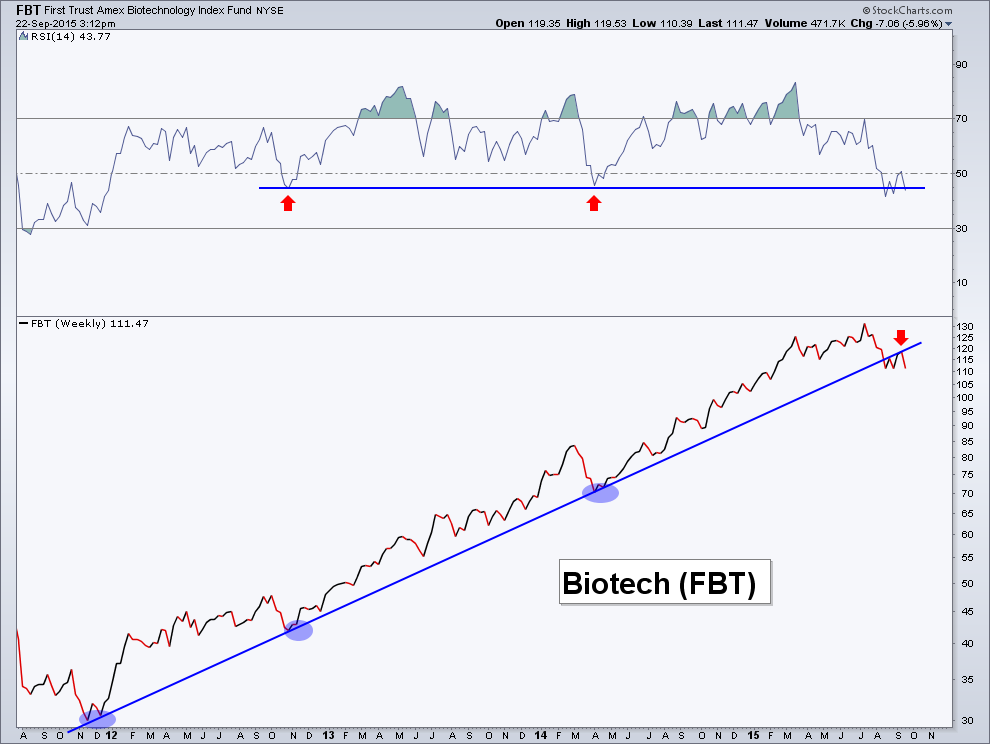
This past April, I highlighted an important long term trend line support for the Biotech ETF (FBT). The trend line is included on this weekly chart of FBT below. As you can see, this trend line had been a level of support for the last several years as this group of Biotech stocks helped lead the health care sector.
However, now that price has broken below this trend line, what once was once support may now be resistance.
This is what we are potentially seeing now with the Biotech Sector (FBT).
So what should we be watching here? Well, price has tested the underside of this important level and been unable to regain it (thus far). So we should now watch to see if this broken trend line now serves as resistance.
Now let’s turn the focus to momentum, specifically the Relative Strength Index (RSI). In the top panel of the chart we can see it is trying to find its footing around a level of prior support. But, as of yet, it hasn’t been able to get up off the mat.
Biotech Sector ETF (FBT) – Long-Term Trend Broken?
Thanks for reading.
The information contained in this article should not be construed as investment advice, research, or an offer to buy or sell securities. Everything written here is meant for educational and entertainment purposes only. I or my affiliates may hold positions in securities mentioned.
Twitter: @AndrewThrasher
Any opinions expressed herein are solely those of the author, and do not in any way represent the views or opinions of any other person or entity.


")

 Rolling Over At Key Fibonacci Level?")

