Over the past few years, investors have endured some sharp corrections. And while looking at price patterns, one stuck out to me… and may be warning of another downturn soon.
Today’s 2-pack features arguably the two most important stock market indices: the Nasdaq Composite and the S&P 500 Index on a “weekly” basis with a 4 year look back period.
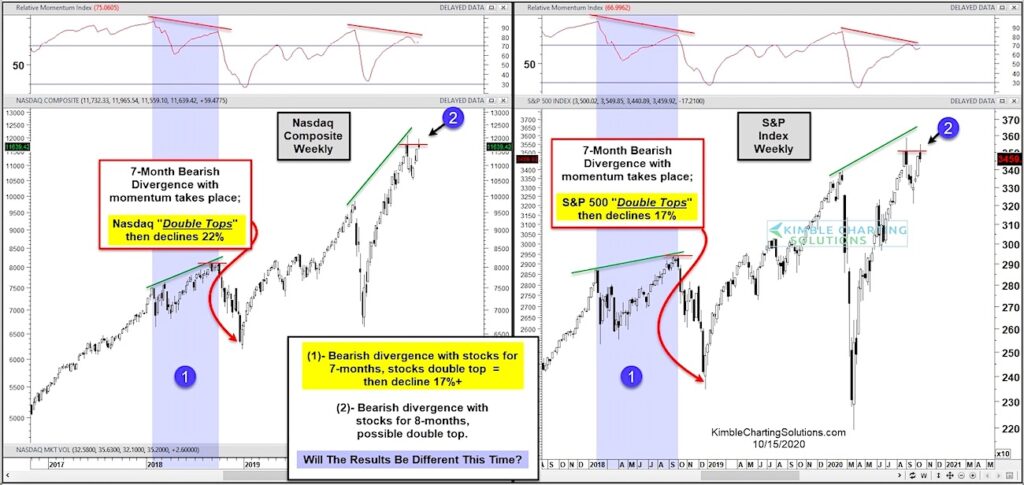
Both charts highlight the multi-month lead up to the 2018 stock market correction in the blue shaded area marked by each (1). During that time, both the Nasdaq and the S&P 500 made new highs while momentum made lower highs. As well, the indices made short-term “double tops” before heading lower. This divergence and double top ultimately lead to corrections of 22% and 17% on these indices.
Fast-forward to 2020, and we are seeing eerily similar multi-month divergences on the Nasdaq and S&P 500 at each (2). And at the same time, both indices have formed possible double tops. Will it be different this time? Stay tuned!
Note that KimbleCharting is offering a 2 week Free trial to See It Market readers. Just send me an email to services@kimblechartingsolutions.com for details to get set up.
Twitter: @KimbleCharting
Any opinions expressed herein are solely those of the author, and do not in any way represent the views or opinions of any other person or entity.


: Showing Some Signs of Emerging Strength")
