Best Buy stock (BBY) has been on an amazing run rallying over 65% since the start of 2014. Is it time to take to a breather? The evidence is pretty convincing that it is.
Here’s a list of indicators and occurrences that are concerning me. Use the Best Buy stock chart below for reference.
- Price is testing resistance from the mid 2000’s high
- Simultaneously, relative strength is testing declining trend resistance.
- The weeks high reversed at the upper bollinger band area.
- Momentum has weakened substantially on this most recent three month rally. Is RSI forming a head and shoulders top?
Best Buy Stock Chart – Running Out Of Steam & Into Resistance?
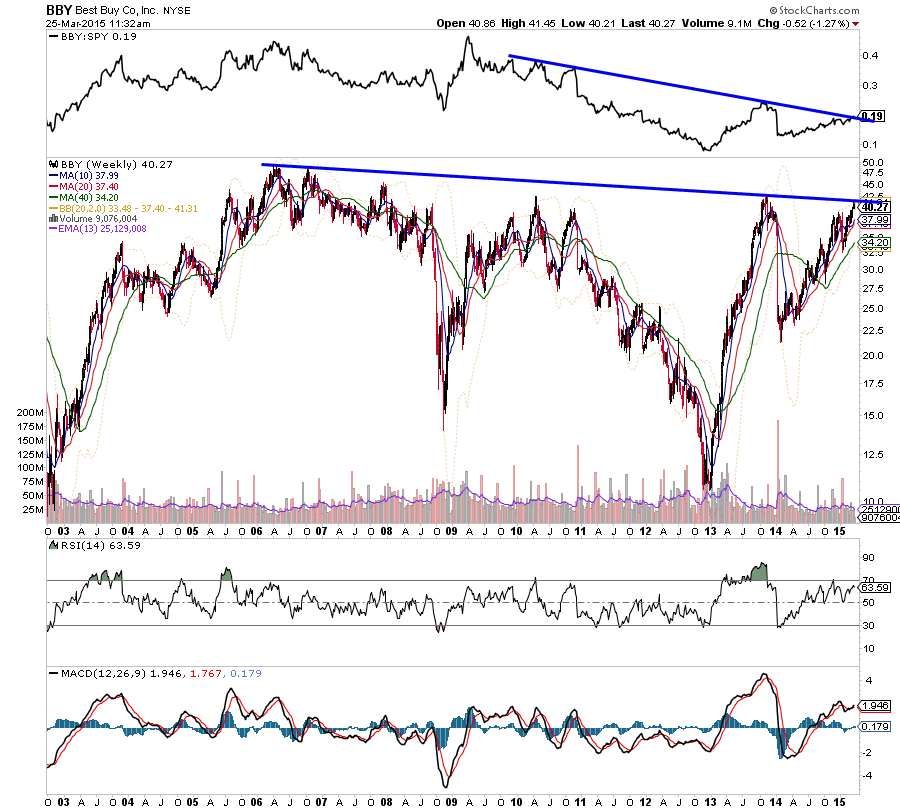
It’s worth watching to see if BBY stages a key reversal week here. If so, that would line up nicely for bears and profit takers on multiple time frames. We have no way of knowing whether this leads to just a minor pullback or something more. That said, this is huge resistance level where large sell-offs in Best Buy stock price have started before.
Thanks for reading!
Follow Aaron on Twitter: @ATMcharts
No positions in any mentioned securities at the time of publication. Any opinions expressed herein are solely those of the author, and do not in any way represent the views or opinions of any other person or entity.

: Worrisome to Broader Market?")


