This morning, Bed Bath & Beyond NASDAQ: BBBY released their 8-K.
In the 8-K, the company announced they had reopened almost all retail stores after closing due to the COVID-19 pandemic.
For the month of June, Bed Bath & Beyond’s (BBBY) total comparable sales were positive and the company generated positive cash flow.
As part of the company’s restructuring plan, Bed Bath & Beyond expects to generate between $350M – $450M in asset sales.
In addition, they are in the process of reducing inventory at retail stores by up to $1B. As of the end of fiscal Q1, the inventory reduction program is more than halfway complete.
Bed Bath & Beyond’s stock price is up over 6.5% midway through Tuesday’s trading session. Let’s review our weekly cycle analysis.
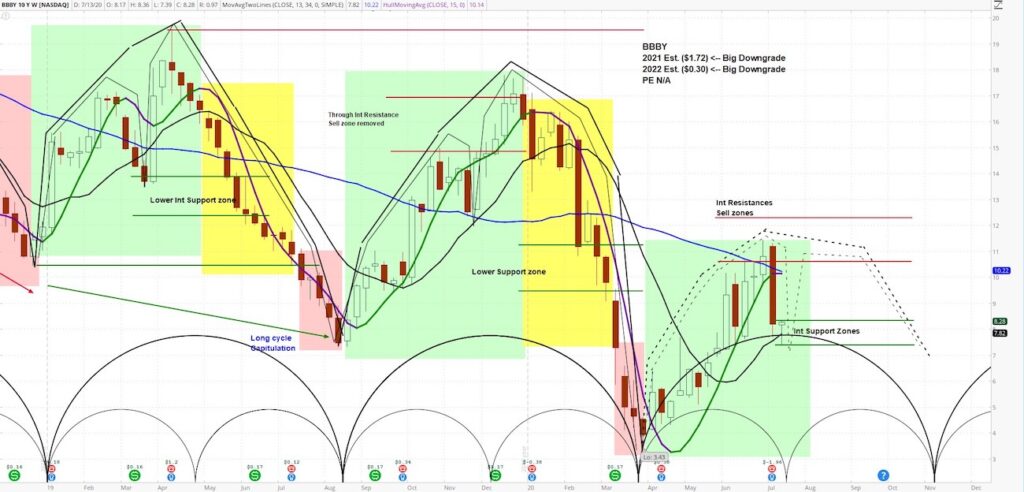
Bed Bath & Beyond (BBBY) Weekly Chart
At askSlim we use technical analysis to evaluate price charts of stocks, futures, and ETF’s. We use a combination of cycle, trend and momentum chart studies, on multiple timeframes, to present a “sum of the evidence” directional outlook in time and price.
askSlim Technical Briefing:
The weekly cycle analysis suggests that BBBY is due to form a mid-cycle low in an overall negative pattern. The mid-cycle low is due to form in the middle-to-end of July. The next dominant cycle low is due between the end of October and early November.
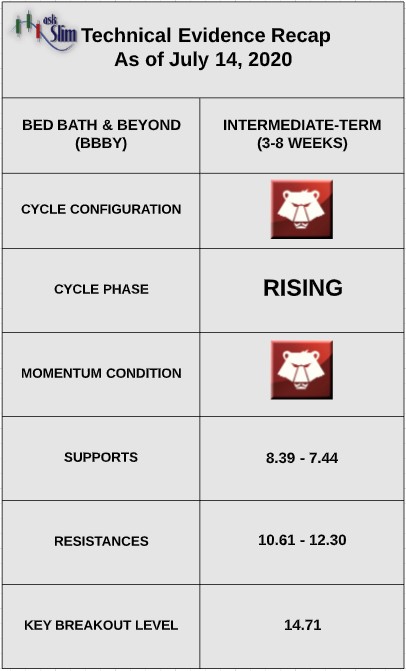
On the upside, there intermediate-term resistances from 10.61 – 12.30.
On the downside, there are intermediate-term supports from 8.39 – 7.44.
For the bulls to regain control of the intermediate-term, we would need to see a weekly close above 14.71.
askSlim Sum of the Evidence:
BBBY is due to form a short-term low in the middle-to-end of July. There is a likelihood that the stock retests the intermediate-term resistance zone beginning at 10.61 by the end of August. After that, risks increase for another move back on the downside.
Twitter: @askslim
Any opinions expressed herein are solely those of the author, and do not in any way represent the views or opinions of any other person or entity.


