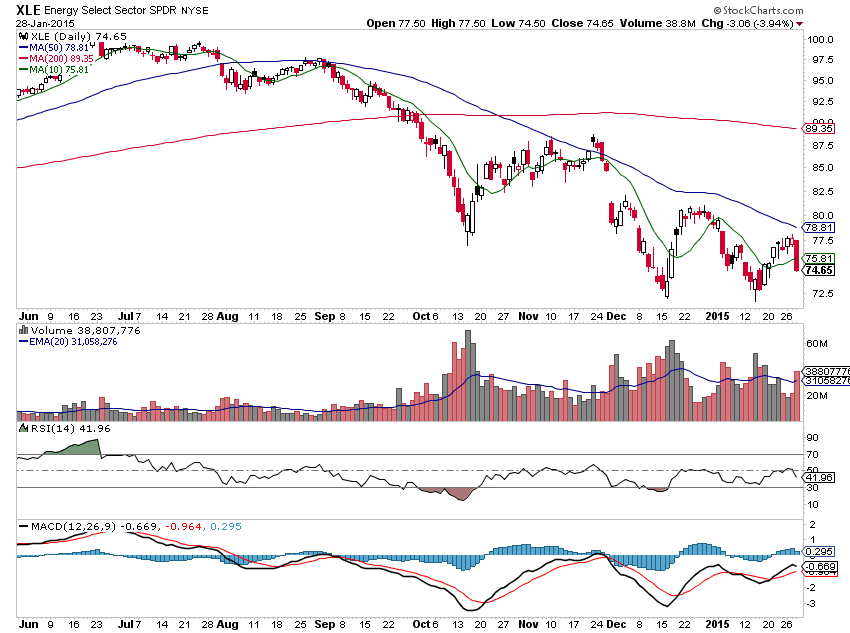
Energy stocks had an awful Wednesday with the Energy Select Sector SPDR (XLE) losing 3%. What’s surprising is the ETF didn’t even test the falling 50 day moving average. Generally sellers wait for a test of the moving average when it’s so close by, but they couldn’t wait to sell the ETF and its several underlying energy stocks today.
Several charts of key stocks within the energy sector are emerging with bearish continuation patterns.
First, let’s take a look at the sector ETF.
XLE Energy Sector ETF Chart
After digging through the group, there are quite a few bearish continuation patterns in play for individual stocks. Let’s take a look.
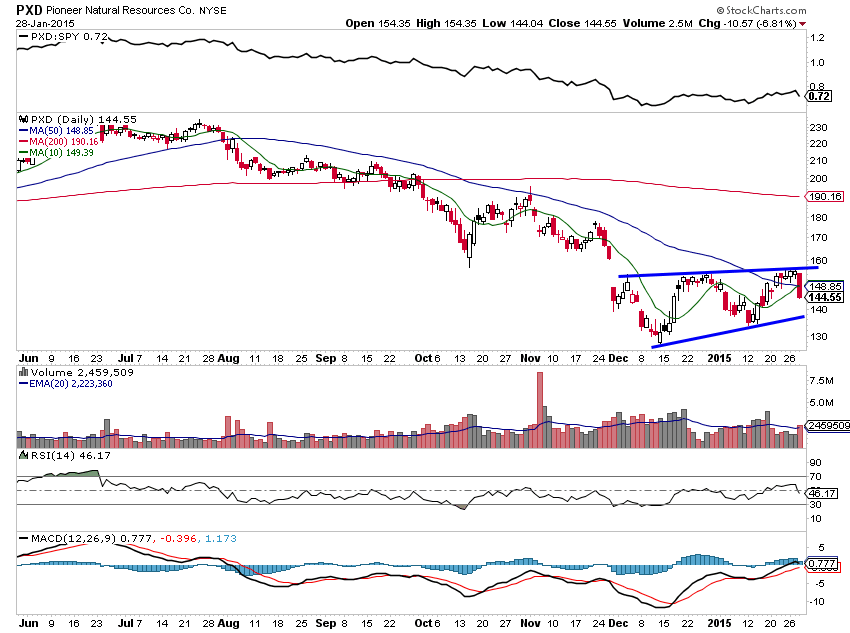
Pioneer Natural Resources (PXD) has traded within this bearish pennant for nearly two months now. Note during the corrective process, momentum has maintained a negative tune.
Pioneer Natural Resources (PXD) Stock Chart
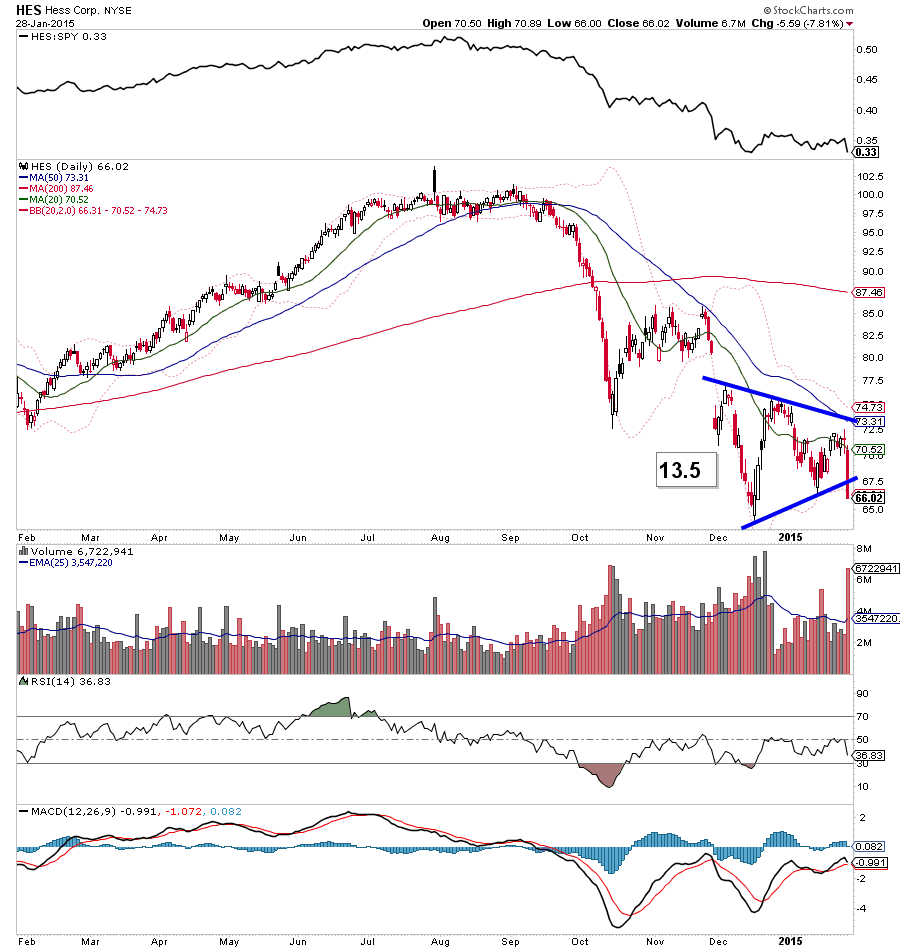
Hess (HES) reported earnings Wednesday morning and promptly broke a symmetrical triangle lower. This bearish continuation pattern measures to the mid 50’s. That said, it’s always important to watch for downside follow through as confirmation.
Hess (HES) Stock Chart
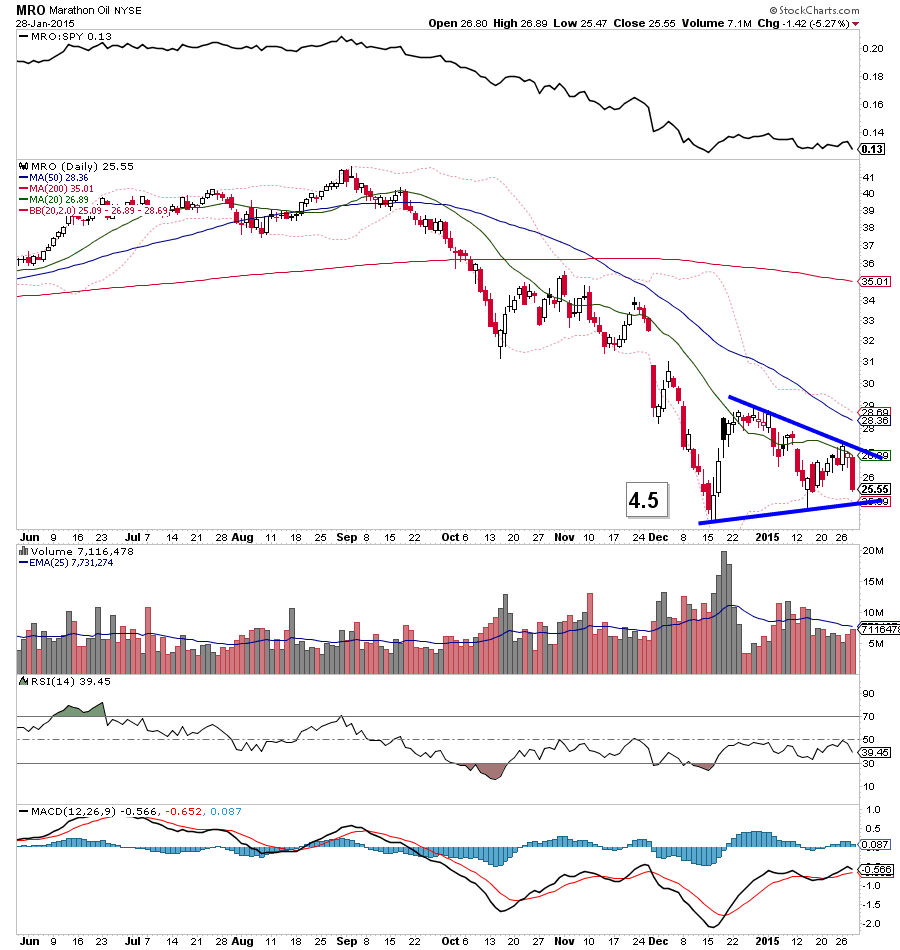
Marathon Oil (MRO) has the same look at HES with a two month long symmetrical triangle. Unlike Hess, it’s failed to break down yet. Like HES, it projects prices could fall another 15%.
Marathon Oil (MRO) Stock Chart
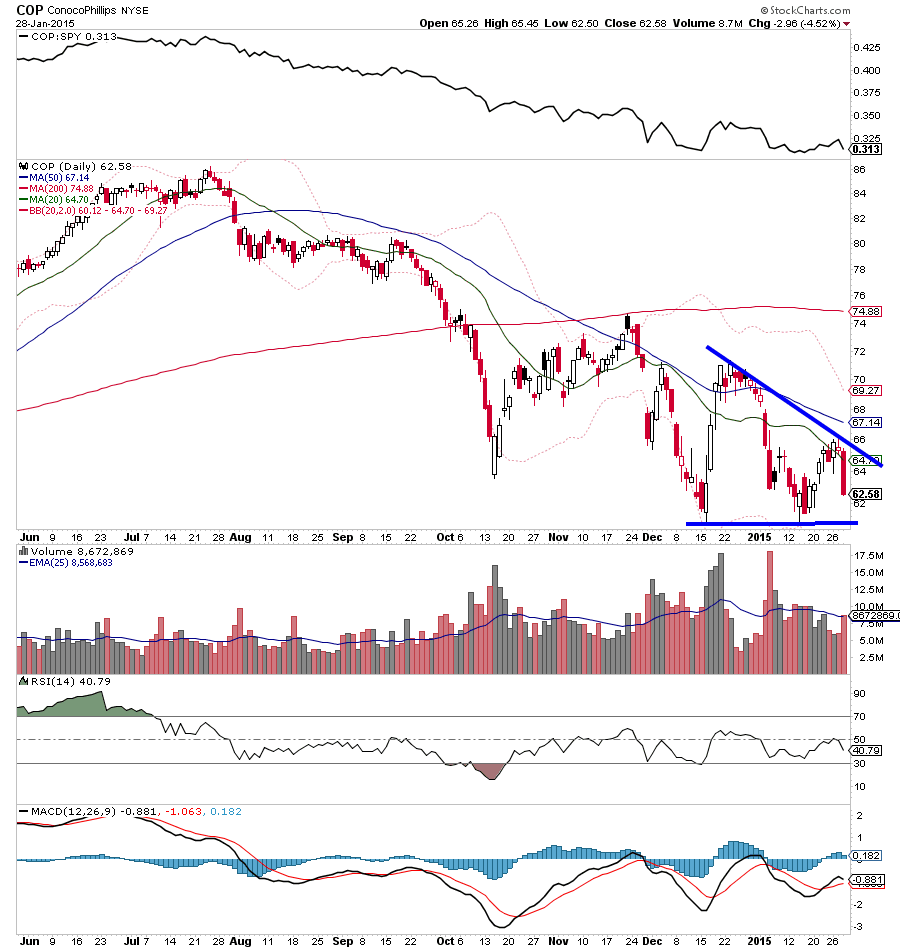
The descending triangle consolidation in Conoco Phillips (COP) has an ominous hue to it with bounces from the 61 level getting weaker and weaker. Again, if this bearish continuation pattern were to break lower, it suggests COP could fall another 10-15%.
Conoco Phillips (COP) Stock Chart
Obviously this rash of downside setups is concerning to energy investors. Of course it’s not a given that these patterns break down and meet their downside objectives, but the amount of charts sending the same message leads me to believe it’s quite possible and investors should be prepared for more downside.
Thanks for reading!
Follow Aaron on Twitter: @ATMcharts
No positions in any mentioned securities at the time of publication. Any opinions expressed herein are solely those of the author, and do not in any way represent the views or opinions of any other person or entity.


