 Recently I was asked by a couple of readers of See It Market to write about candlestick patterns and analysis. Early in my TA education, a mentor gave me the book Japanese Candlestick Charting Techniques, by Steve Nison. It remains one of the most influential books on Technical Analysis (TA) for me, likely because of Nison’s description of the bulls’ vs. bears’ psychology.
Not everyone is a fan of candlestick patterns and analysis. For example, dojis and shooting stars are widely known to indicate a warning about the end of a trend, but critics argue these patterns are present throughout the trend and can often give false signals. What makes one doji significant and another one not? I have found candlesticks are best read when there are accompanying TA signals to confirm the price action. Nothing happens in a vacuum, and candlestick patterns without TA confirmation are often just daily noise.
To illustrate this, the charts of Yahoo Inc. (YHOO), Green Mountain Coffee, Inc. (GMCR), and Tesla Motors, Inc. (TSLA) have recently formed some classic topping patterns. The critical thing to note is that when price action, represented by candlestick patterns, coincides with strong confirming TA, these patterns carry a weighted significance not to be ignored.
YHOO Candlestick Patterns
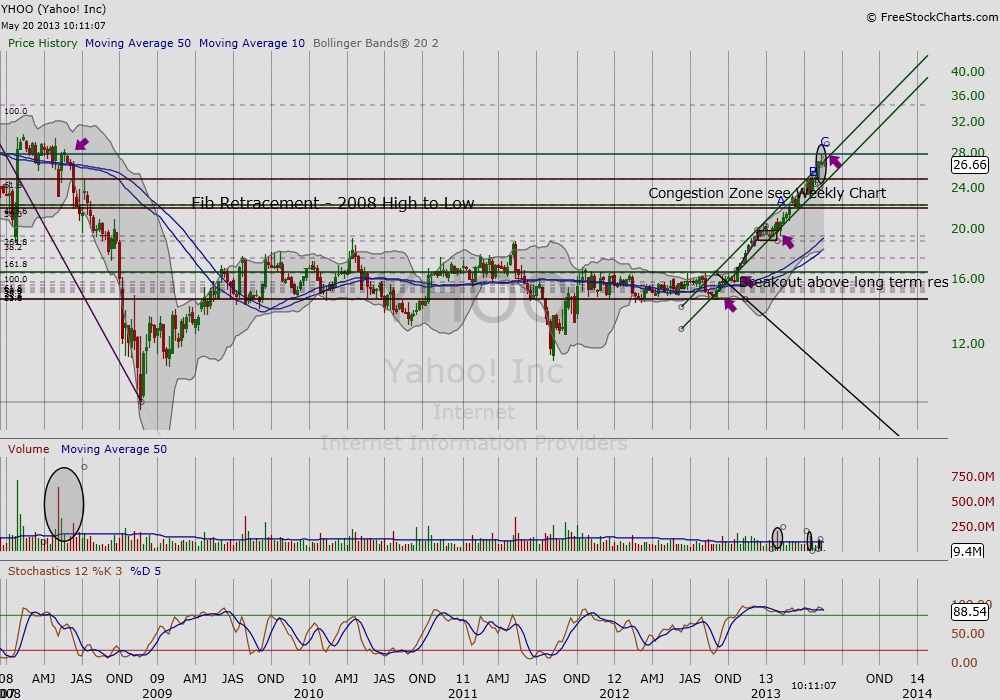
After nearly seven months on the move, it is easy to guess that it might be time for some profit taking on Yahoo Inc. (YHOO). Below is a weekly chart of YHOO from February 2012 to the present. We see the breakout in October and the channel it traded in over the following months. In Figure 1 (YHOO weekly, February 2011-present), weeks A, B and C indicate times when the bull/bear battle heated up, noted by the accompanying volume. For both weeks A and B, zooming in to the day chart (Figure 2) shows us that the aggressive attack initiated by the bears was easily pushed back by the bulls when the skirmish neared support. At point C, we see not only the classic warning of a shooting star after an extended run but, zooming out again in Figure 3 (YHOO weekly, spring 2008 – present), we can see we have entered a congestion zone. Figure 3 shows we have returned to the price levels of August-September 2008, where the large candlesticks and heavy volume tell the story of the carnage of that time. Today, the shooting star warns us YHOO has now returned to a point of resonance and should not be ignored. Click images to enlarge.
Figure 1 – YHOO
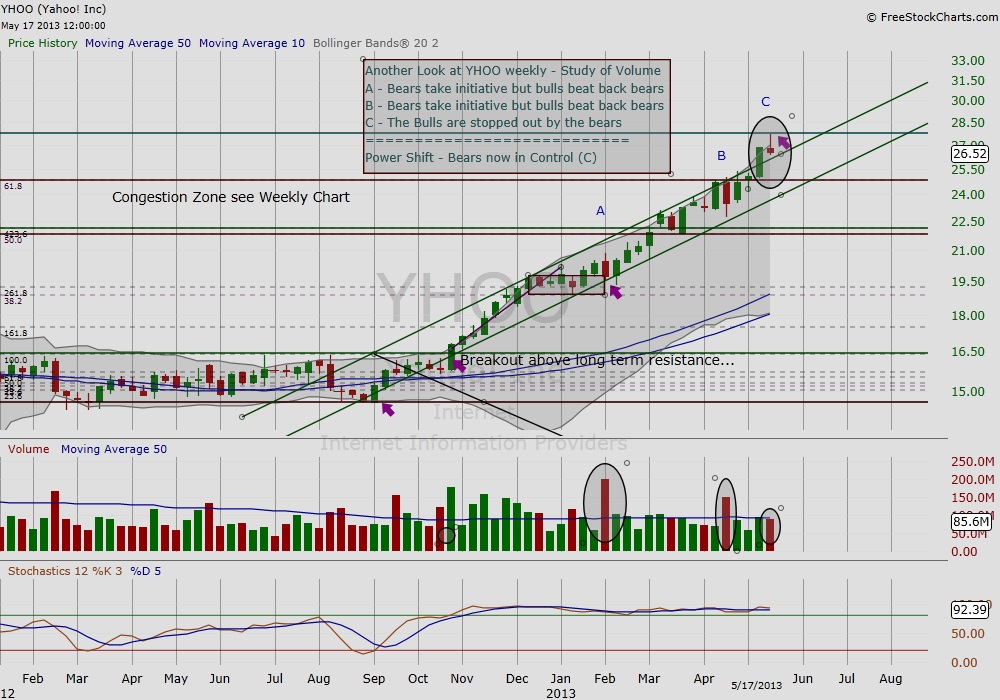
Figure 2 – YHOO
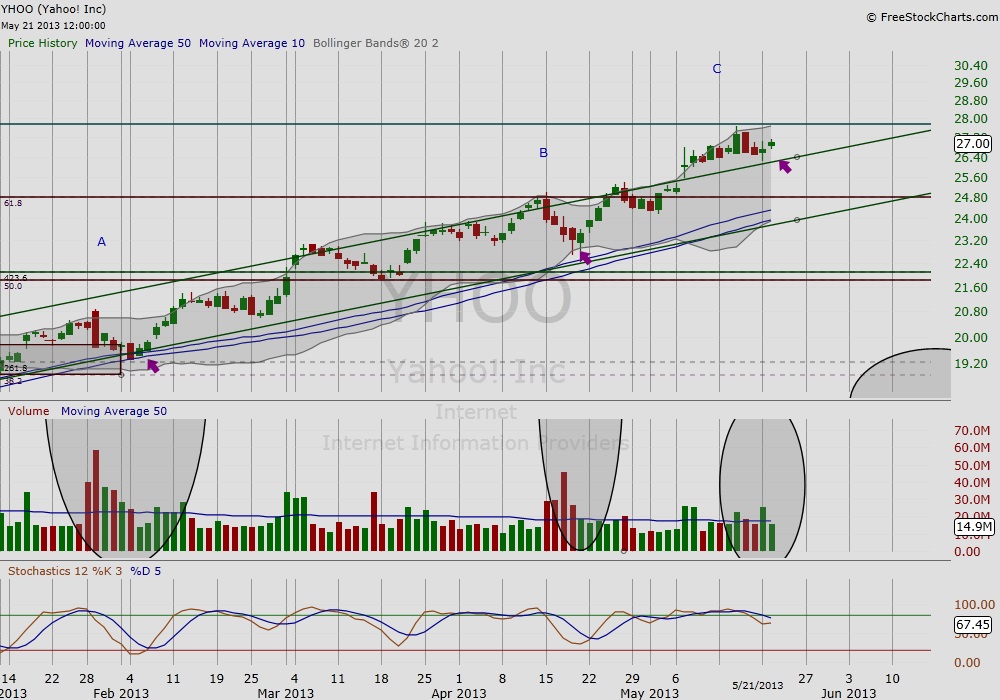
Figure 3 – YHOO
GMCR Candlestick Patterns
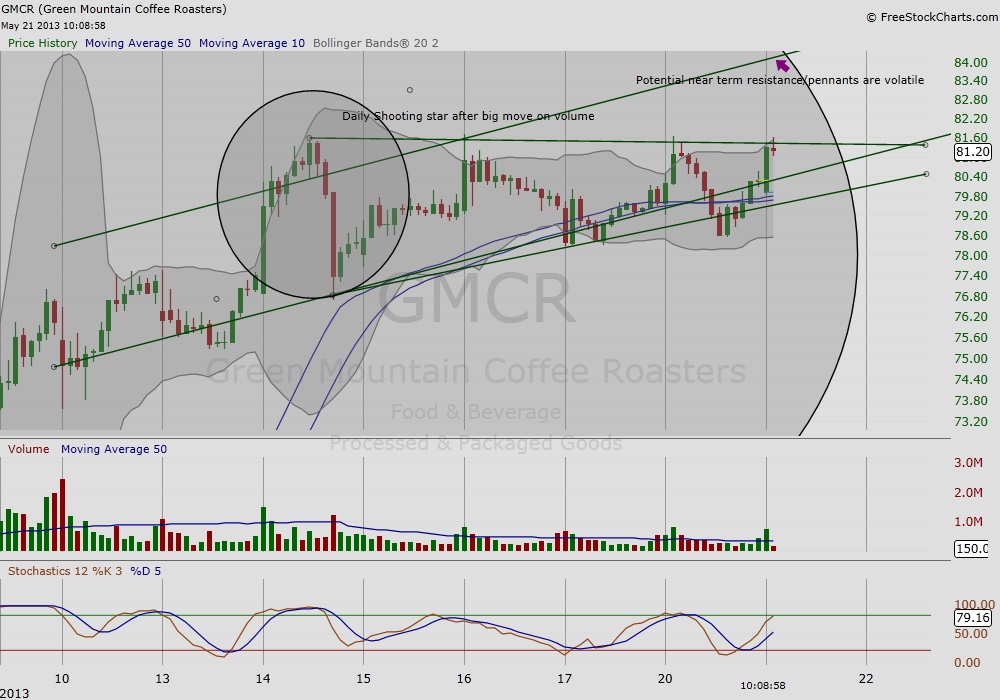
We are familiar by now that stocks, once trending, begin to trade in reasonably neat and predictable channels. However, once the behavior changes, it is best to pay heed. In this case, Green Mountain Coffee, Inc. (GMCR) broke out of the channel and formed the flag pole shown at point C in Figure 4 (GMCR daily, September 2012-present). The latter action is a warning when “the price breaks above the channel line rather than be contained by it. This is a sign that the underlying trend is accelerating and that its end is coming closer,” (Kirkpatrick and Dalquist, p. 238). The flagpole formed after breaking through the trending channel is a warning to those holding GMCR that its trend may be ending soon. A shooting star formed in the following days. Nison writes, “Since it is one session, it is usually not a major reversal signal as is the bearish engulfing pattern or evening star,” Nison, p. 74. What the shooting star, small body with long upside wick, tells us is that the market intraday has rejected the highs. However, as Nison warns, because the signal is not as strong as either the bearish engulfing or evening star, then it is prudent to watch and wait for confirmation. In figure 5, we see that following the initial formation of the shooting star on May 14 a pennant formed the following days in the intraday chart. While optimistic bulls may see the pennant as a sign of continuation, it is best to note the risk associated with a shooting star formation because the pattern not only follows a strong rally, but also a change in stock behavior. Click images to enlarge.
Figure 4 – GMCR
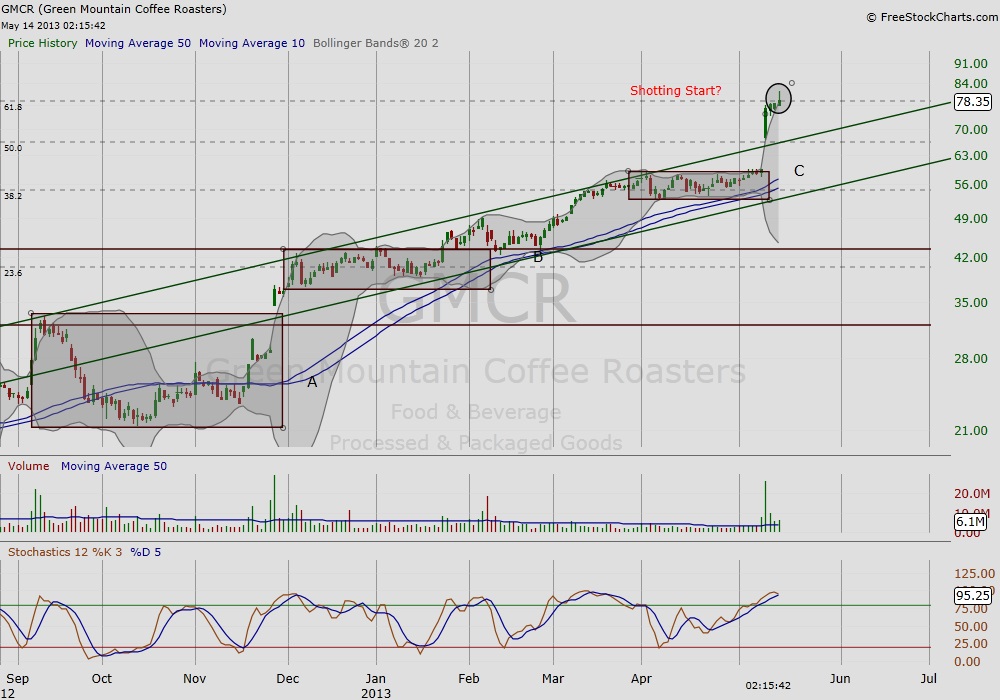
Figure 5 – GMCR
TSLA Candlestick Patterns
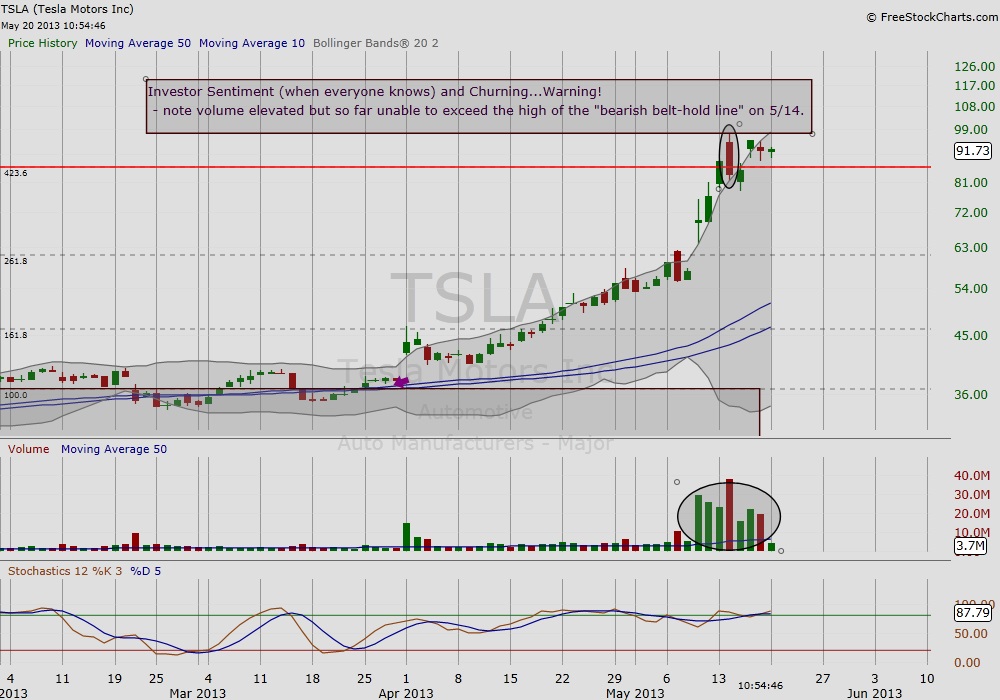
Finally, we’ll take a look at Tesla Motors Inc.’s (TSLA) great move and subsequent candlestick pattern warning. The dark-cloud cover forms after an impressive rally where TSLA breaks through the 423.6 Fib extension (in red) from the 2011-2012 high/low. Prior to the breakout, TSLA traded sideways for a full two years. This coiling created the pent-up energy that was ultimately let loose, as seen in the run below at Figure 6 (TSLA daily, October 2012-present). However, and what we have seen time and again, the gathering momentum is a warning after an extended run. At 261.8% Fib extension, TSLA skyrocketed to reach the next target. The dark cloud cover is not to be ignored. The following days (Figure 7), we see volume escalate, but price stall. This churning action serves as a warning that as the battle rages shown by the elevated volume, the bulls’ momentum is stalled.
Figure 6 – TSLA
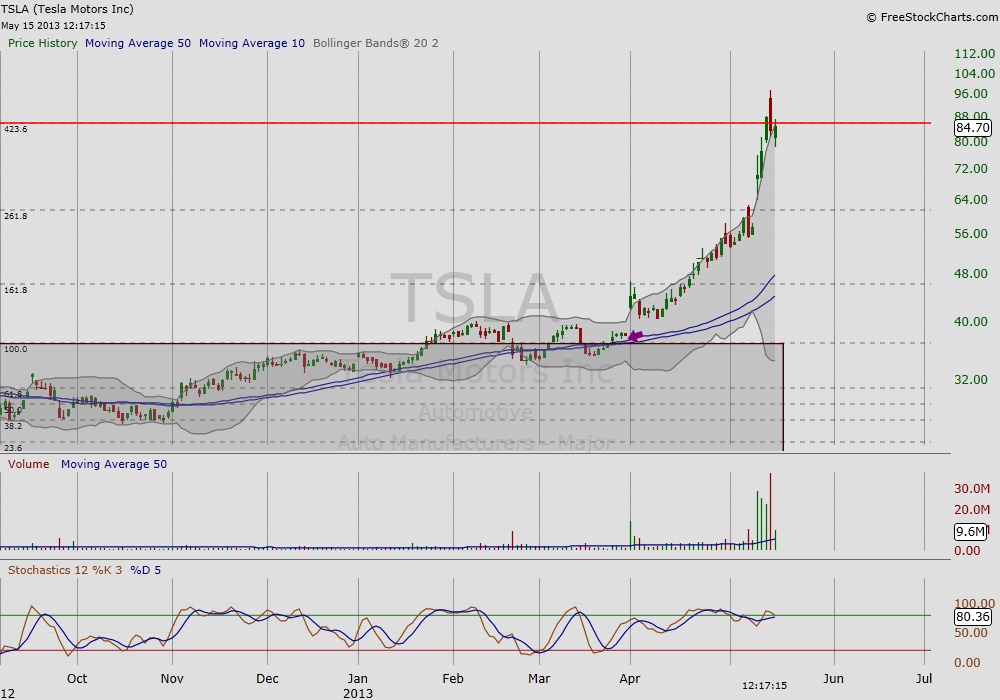
Figure 7 – TSLA
Finally, I leave you with a lesson from the dot.com bubble of 2000 that remind us that stocks can continue to go higher even when all the warning signals are firmly in-place. However, if it is about risk and reward, candlestick patterns, when strongly confirmed by accompanying TA, can offer invaluable clues to rising risk of a pending reversal. Thanks for reading.
Also read “Stock Market Nearing Critical ‘Time and Price’ Juncture” by Maria Rinehart for more on GMCR, TSLA, and the stock market as a whole.
References:
- Kirkpatrick and Dalquist (2007). Technical Analysis: The Complete Resource for Financial Market Technicians. Pearson Education Inc. : NJ.
- Nison, Steve (2001). Japanese Candlestick Charting Techniques, Second Edition. New York Institute of Finance Inc.: NY.
- Charts from freestockcharts.com.
No position in any of the mentioned securities at the time of publication.
Twitter: @RinehartMaria and @seeitmarket

: Cup (and Maybe Handle) Watch")
 Reaches Important Price Support")

