The recent rally has given investors hope that the bear market is nearing an end.
But hope isn’t an investment strategy.
To be clear, I don’t think a new bull market is emerging just yet. At least I haven’t seen signs of it. BUT I remain open-minded.
So what do we need to see?
- slowing inflation (one month of good numbers)
- tech stocks waking up (finally, this month)
- most importantly, “price” reversing bear trends / indicators (not yet)
Today we take a broad view of the S&P 500 to see how “price” is looking. Yes, we have made some in-roads, but no we aren’t quite there yet.
Note that the following MarketSmith charts are built with Investors Business Daily’s product suite.
I am an Investors Business Daily (IBD) partner and promote the use of their products. The entire platform offers a good mix of analysts, education, and technical and fundamental data.
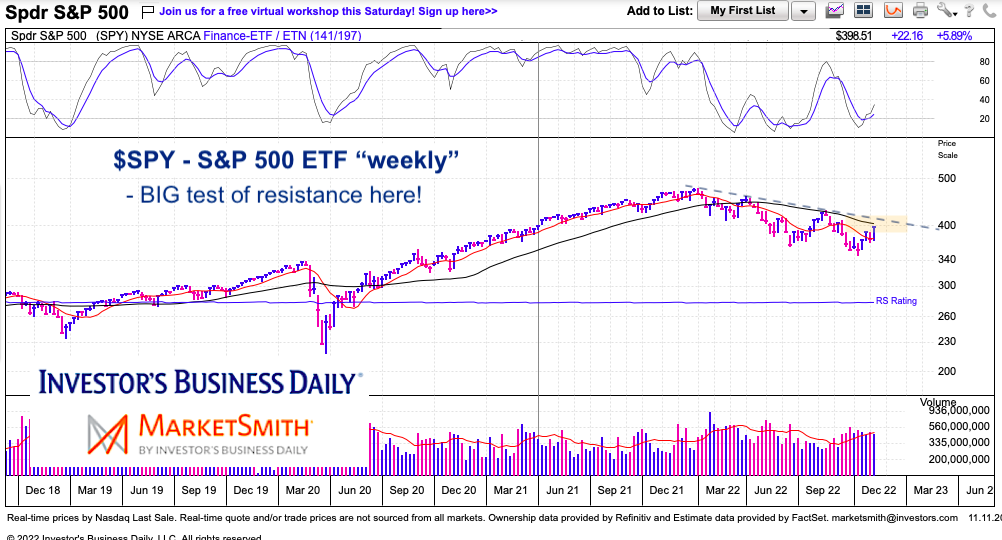
S&P 500 ETF (SPY) “weekly” Chart
From high to low, the S&P 500 ETF has fallen from nearly $480 to $348. The 38.2 Fib is at $402. This area is also marked by the falling 40-week moving average and down-trend line.
A strong move above this area would be bullish, while remaining below it is bearish. Not much more to say.
Twitter: @andrewnyquist
The author may have a position in mentioned securities at the time of publication. Any opinions expressed herein are solely those of the author, and do not in any way represent the views or opinions of any other person or entity.


