The stock market has been in a corrective sideways move for the better part of 2018.
Is it ready to decline even lower?
Well if the “average stock” is any indication, then investors should be concerned.
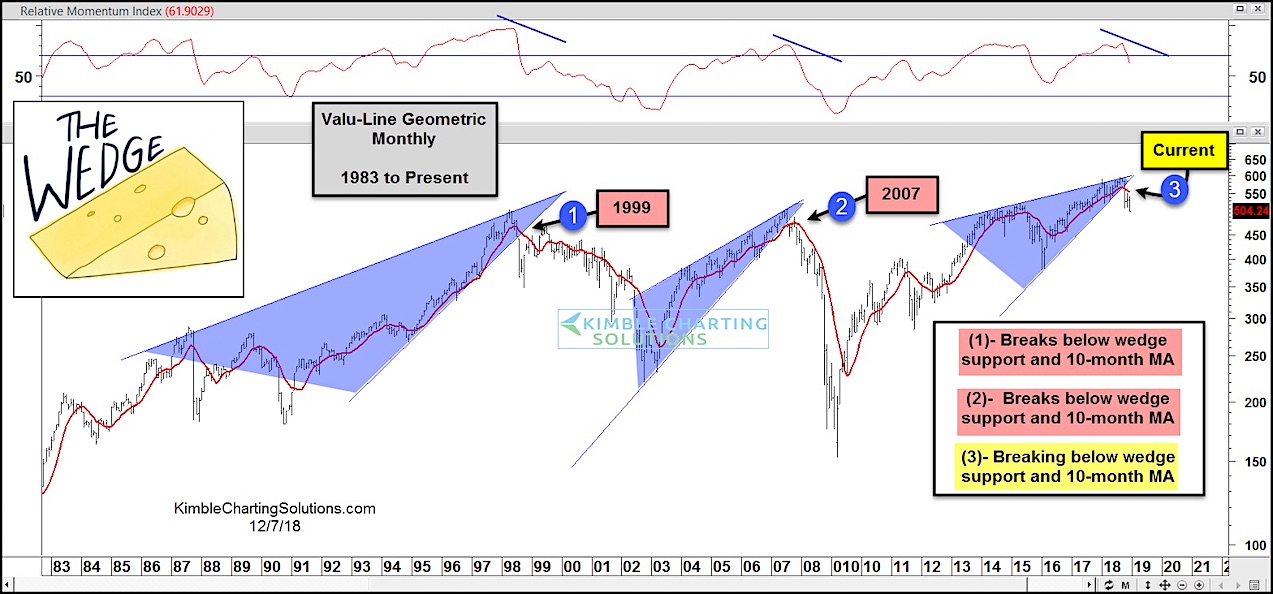
The “monthly” chart below is of the Value Line Geometric Index (INDEXNYSEGIS: VALUG), which plots the price of an average stock in today’s market. We can see that a bearish wedge pattern has developed in a similar fashion to 2007 and 1999.
It’s notable that in each of the past two breakdowns (1) and (2), the price broke below wedge support and its 10-month moving average.
It appears to be doing the same thing today. Careful here!
Value Line Geometric Chart – Bearish Wedges
Note that KimbleCharting is offering a 2 week Free trial to See It Market readers. Just send me an email to services@kimblechartingsolutions.com for details to get set up.
Twitter: @KimbleCharting
Any opinions expressed herein are solely those of the author, and do not in any way represent the views or opinions of any other person or entity.

 Rolling Over At Key Fibonacci Level?")


