The projection that the uptrend, which began in late November, would begin to stall by late March/ mid-April resulted in a mere pullback. By early May, the market was again ready to take another lap with multiple fresh breakouts across sectors. Impressive moves by retail darling, Green Mountain Coffee (GMCR), and futuristic carmaker, Tesla Motors Inc. (TSLA), made for exciting commentary. One of the more interesting debates among traders and investors was whether long beaten down mobile phone maker Research In Motion Ltd., now doing business as BlackBerry (BBRY), was ready to get back in the game with the launch of its new BB10 operating system.
GMCR, a notable retail darling, sports strong and consistent earnings. It is not surprising to see the market show favor and a bit of exuberance for a company that is expected to benefit from a nascent recovery. In contrast, TSLA and BBRY who have both seen their stock prices double in a short period tell a bit of a different story. When once the market was cautious and cynical, the market favoring stocks that have yet to show consistent profitability or even any profitability at all (TSLA) may be just one indication this market is getting a little ahead of itself. At the onset of this uptrend in November, BBRY trading at around $8 was with little doubt by the market to be undervalued and/or underestimated pending the launch of new technology. Within a mere two months, BBRY would more than double. In response to this move, BBRY stock prices formed a pennant in the following months as we see in Figure 1 in order to resolve a potential mispricing.
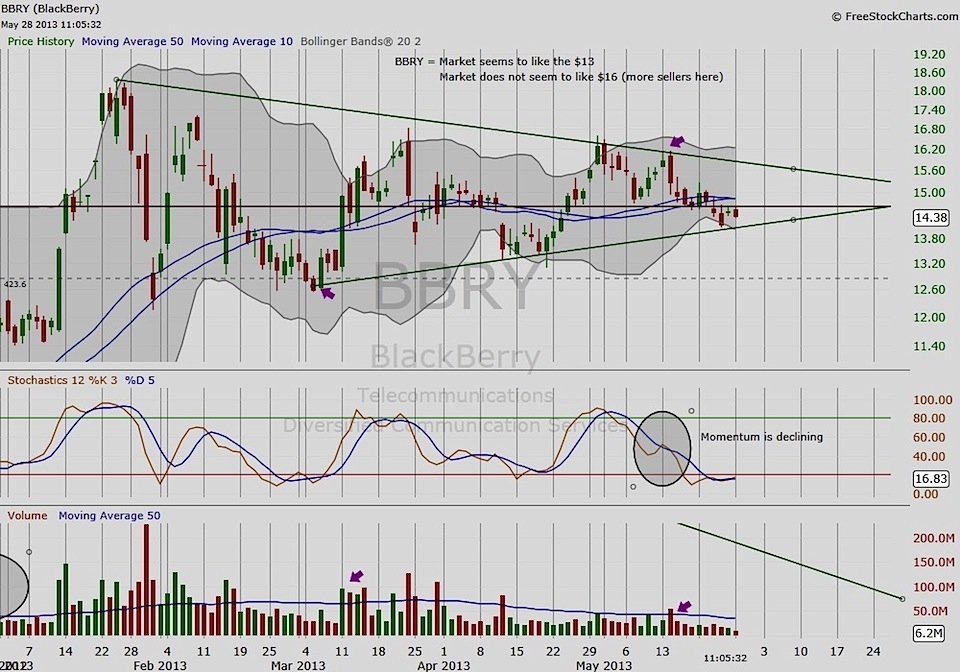
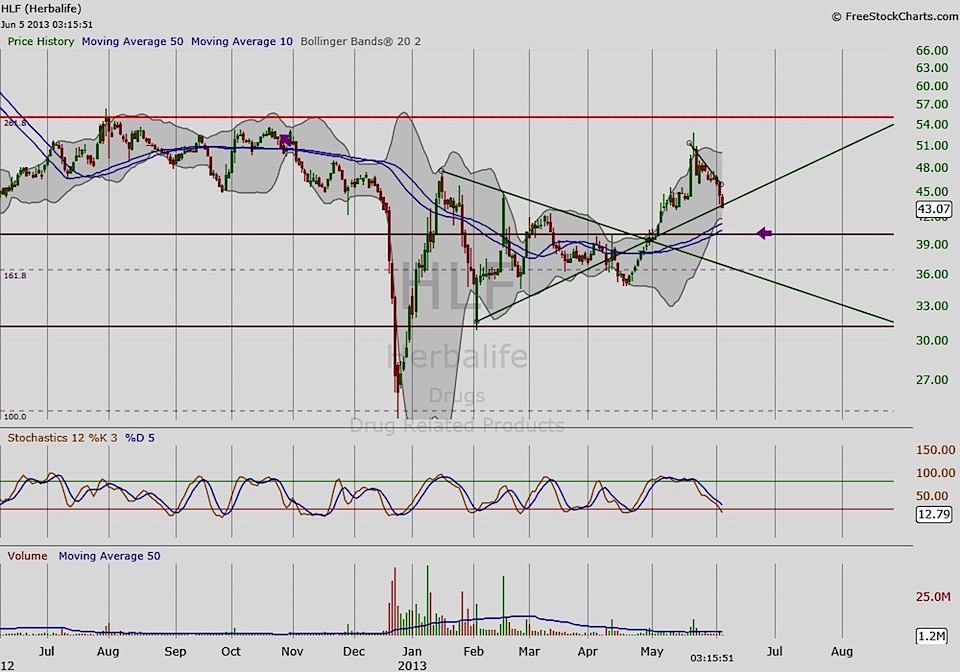
The pennant is an interesting chart pattern; quite a bit of excitement surrounds the pennant for it is considered one of the more bullish patterns favored by momentum traders. It is also one of the more volatile patterns where a break out in one direction often results in a quick reversal to the other side as shown by the daily chart of HLF in Figure 2. Today, after reversing in April from a price break below its pennant, HLF demonstrates strong signs of yet another reversal. Similarly, BBRY recently breaking down from its pennant, the market wonders whether it, too, will reverse or is this sell-off due pending its next earnings report due later this month.
Enjoy your weekend and thanks for reading.
Sources:
- Charts by FreeStockCharts.com
- Astrology dates referenced using Astro.com database
- Earnings data referenced using Nasdaq.com and Investors.com database.
No position in any of the mentioned securities at the time of publication.
Twitter: @RinehartMaria and @seeitmarket


