 After surging 20 percent above its 200 day moving average, the Bank Index (BKX) spent much of August in pain. The index alone fell over seven percent, while several important bank stocks dropped even more. Pullbacks are a natural ebb and flow within market trends, but that doesn’t mean that they are to be bought blindly. Price is the final arbiter, and investor time frames play a role in profit/loss as well. That said, let’s look at some key price levels for the index of bank stocks.
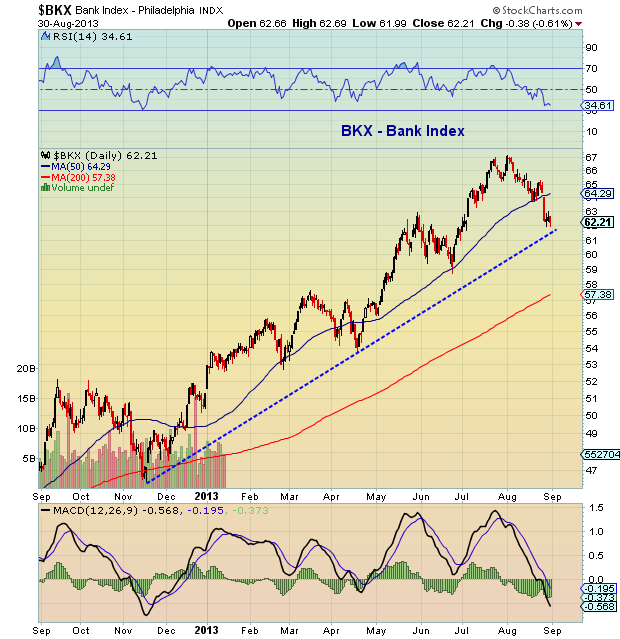
First and foremost, trend lines are always important. In the one year chart below, the trend line from the November lows is clear… and banks stocks have now reverted to the trend. This is an important area to watch for active investors and traders, as a breech of this level would be a warning for both banks stocks and the overall market. Bulls would like to see bank stocks bounce and consolidate. And, understanding that this is a key sector for the market, a bounce here seems likely. But the key to any lasting move higher will be re-taking the 50 day moving average (that it sliced through on the reversion to trend). Looking below the trend line, support comes in at the 200 day moving average and May breakout level around 57/58.
Bank Index – 1 Year Chart
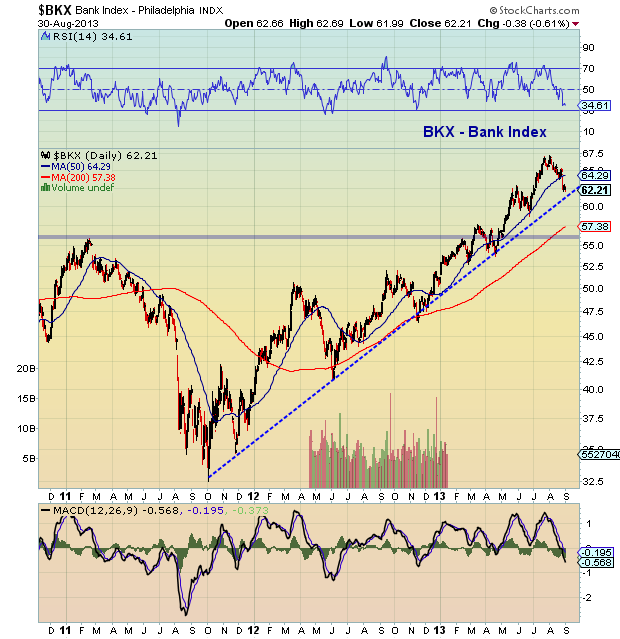
 Zooming out to a 3 year chart offers a similar picture (see below). The trend line dates back to the Euro Crisis lows of late 2011. And this only reinforces the importance of the trend line. That said, it should also be given a little slack, as markets can often become volatile around key trend lines (active investors should be on risk management alert, but also wary of a shakeout). Note as well that the 2011 highs align with the 200 day moving average (more or less), making 56-58 a likely destination should the trend line break.
Bank Index – 3 Year Chart
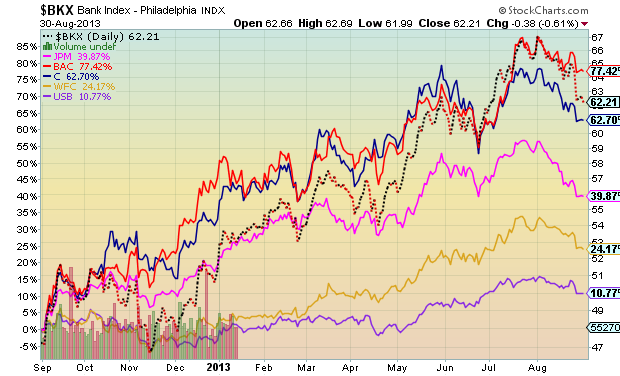
Lastly, let’s look at a 1 year performance chart of some key bank stocks. This serves as a reminder that not all stock setups are created equal.
Bank Stocks Performance – 1 Year Chart
Twitter: @andrewnyquist and @seeitmarket
No position in any of the mentioned securities at the time of publication.
Any opinions expressed herein are solely those of the author, and do not in any way represent the views or opinions of any other person or entity.


