Investors understand the importance of the banks to the economy and the broader market.
And since bottoming with the coronavirus crash, the $BKX Bank Index has more than doubled.
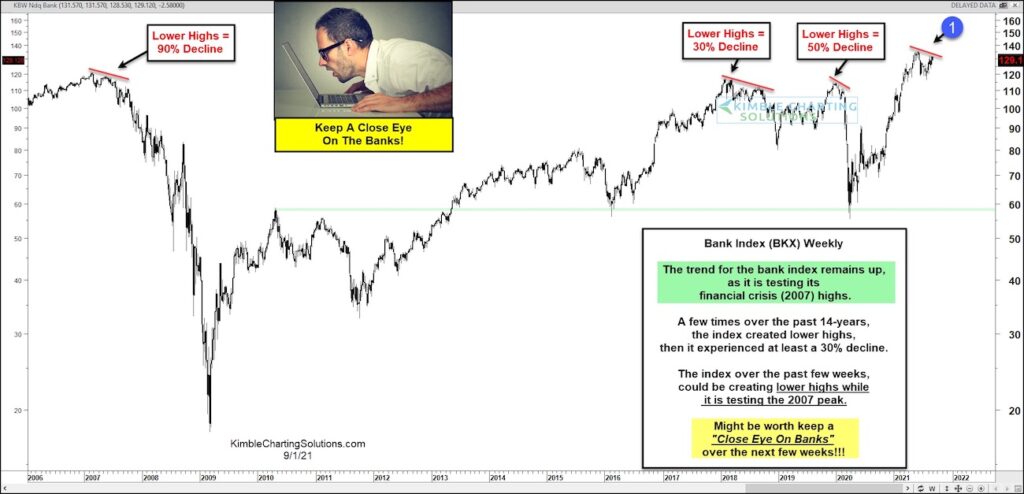
BUT, this year has seen the Bank Index slow its roll – see point (1) on the $BKX “weekly” chart below.
As you can see, the index made a high earlier this year and hasn’t been able to exceed that high. This divergence is a bit concerning when adding historical context.
Now, of course this index could continue to rally and make new highs (and none of this would matter). But if it doesn’t, then we have a problem.
As you can see, in 2007 a lower high netted a 90% decline. And in the past 4 years, we have had two lower highs that produced declines of 30% and 50%.
Let’s hope we don’t see a lower high form in 2021… would be an omen for the broader market. So keep an eye on the bank index. Stay tuned!
BKX Bank Index “weekly” Chart
Note that KimbleCharting is offering a 2 week Free trial to See It Market readers. Just send me an email to services@kimblechartingsolutions.com for details to get set up.
Twitter: @KimbleCharting
Any opinions expressed herein are solely those of the author, and do not in any way represent the views or opinions of any other person or entity.


