The health of the global economy relies on several key factors, but one of the more important ones is shipping.
And the Baltic Dry Index (BDI) is a solid barometer for economic activity.
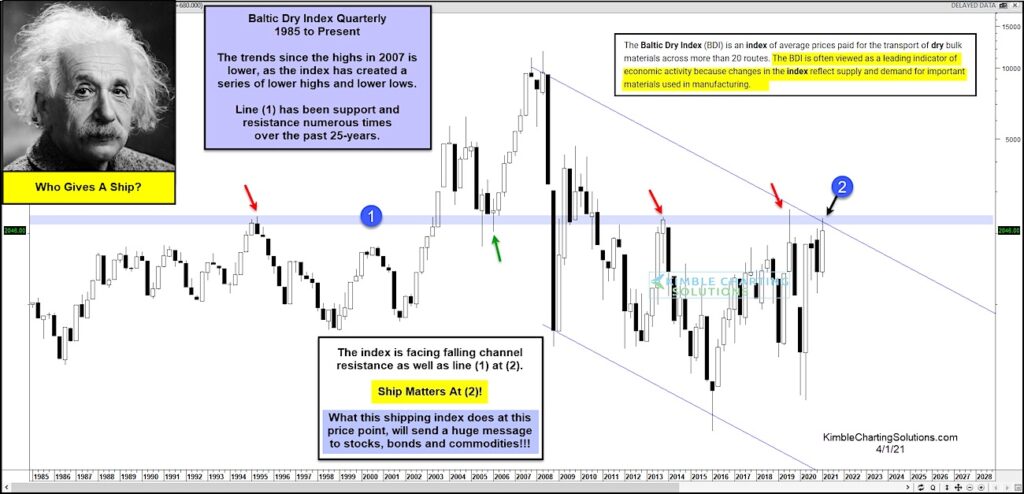
BDI is an index of average prices paid for the transport of dry bulk materials across more than 20 shipping routes.
Today’s chart is a long-term “quarterly” chart of BDI. Notably, trends have been lower since peaking in 2007. But BDI has been rising over the past 5 years and is now testing dual breakout resistance at (2). This resistance comprises of the falling upper channel line, as well as an important 25-year price resistance and support line marked by (1).
Who gives a ship? Well, investors in stocks, bonds and commodities should! Stay tuned!
Baltic Dry Shipping (BDI) Index “quarterly” Chart
Note that KimbleCharting is offering a 2 week Free trial to See It Market readers. Just send me an email to services@kimblechartingsolutions.com for details to get set up.
Twitter: @KimbleCharting
Any opinions expressed herein are solely those of the author, and do not in any way represent the views or opinions of any other person or entity.


