How can you tell when a chart transitions from a bullish phase to a bearish phase? The ARK Innovation Fund (ARKK) has done just that, as the rally into the January highs rapidly deteriorated with a series of bearish tells along the way.
By stepping back from the “flickering ticks” of day-to-day price fluctuations, we can see how the long-term picture has changed from a period of accumulation to a period of distribution that continues through this week.
In today’s video, we will review the chart of the popular ARK Innovation Fund $ARKK and discuss some of the key guideposts evident during the transition. We will also identify some key “lines in the sand” that would indicate a price reversal of the bear phase and signify a more bullish scenario. Here are a few questions we discuss in the video. See chart further below.
How did price divergences in December 2020 to January 2021 indicate a potential top for ARKK?
What can Fibonacci Retracements tells us about price action in recent months, and what would they suggest about future support and resistance levels?
What is the most important trendline in play for ARKK as this key growth ETF bounces off oversold conditions?
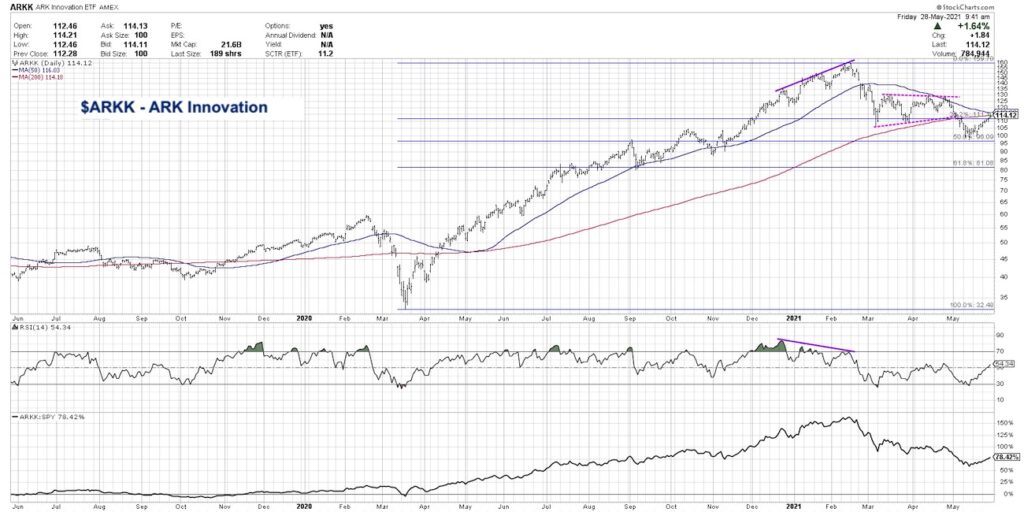
One Chart: $ARKK Ark Innovation Fund (VIDEO)
$ARKK Ark Innovation Fund Chart
Twitter: @DKellerCMT
The author may have positions in mentioned securities at the time of publication. Any opinions expressed herein are solely those of the author, and do not in any way represent the views or opinions of any other person or entity.


