In reference to Monday’s article, we are watching for signs of a reversal in the major stock market indices based on price and momentum.
As a follow-up, we can also look at Mish’s Economic Modern Family of ETFs to see which areas are holding with strength going into Wednesday’s Fed rate hike announcement.
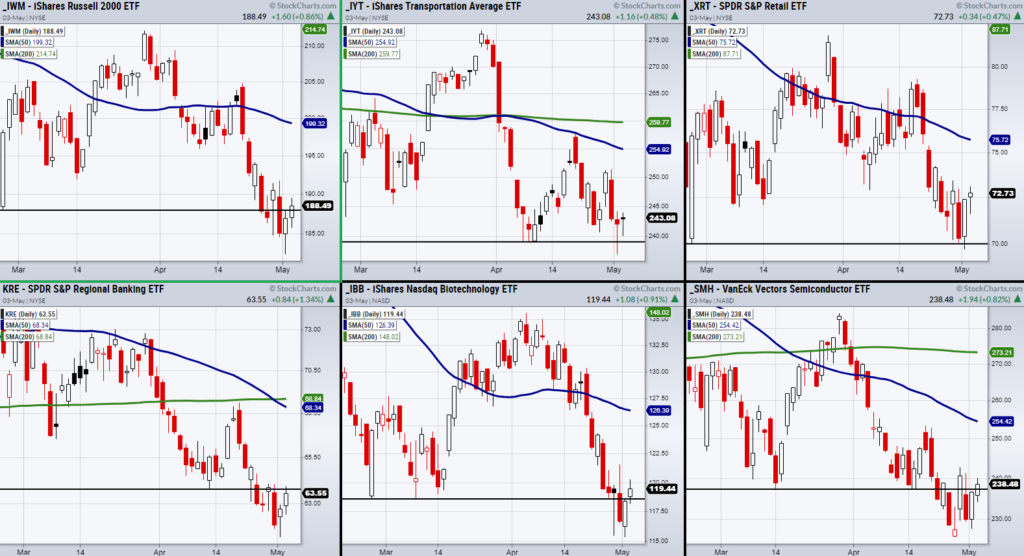
Of the 6 main Family members, surprisingly the Transportation (IYT) and Retail (XRT) ETFs are holding up the best. In terms of percent gain on the day, IYT and XRT are underperforming when compared to the other members.
However, in the above chart, we can see that both are holding over support while, the Russell 2000 (IWM), Regional Banking (KRE), Biotech (IBB), and Semiconductors (SMH) are now clearing or attempting to clear back over support levels that recently failed.
With that said, we can also watch for upside confirmation from a momentum standpoint.
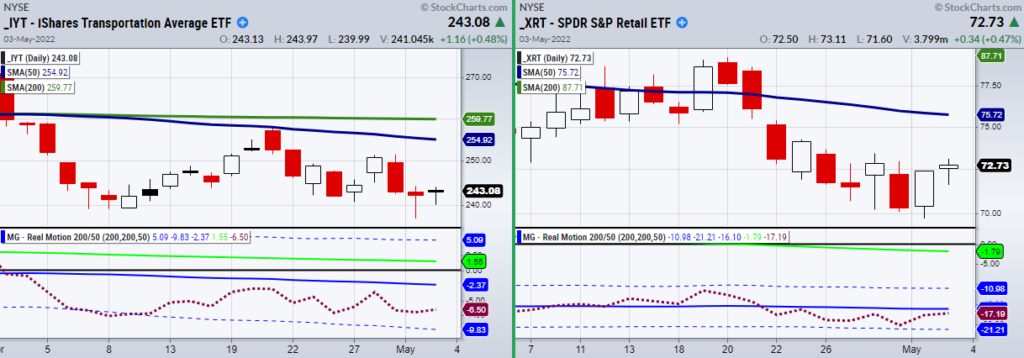
In the above chart, you can see IYT and XRT with our Real Motion indicator (RM) at the bottom. The red dotted line shows RM along with the 50-Day (blue) and 200-Day (green) moving averages.
In the price chart, we also have the 50-day moving average and 200-day moving average.
One thing we can look for when watching RM is for a positive divergence in momentum and price.
This can happen when RM clears the 50-day moving average before the symbol does in price. Notice how close RM is to clearing the 50-day moving average in XRT.
If RM holds, it will likely cross over the 50-day moving average before XRT crosses the 50-day moving average in price.
Having said that, we should watch for a positive divergence when it comes to both IYT and XRT in momentum along with price clearing the 50-day moving average soon after.
Stock Market ETFs Trading Analysis & Summary:
S&P 500 (SPY) 414 is pivotal.
Russell 2000 (IWM) Watching 188 to hold.
Dow Jones Industrials (DIA) support is from 322 to 326.
Nasdaq (QQQ) Watch for it to hold over 318.
KRE (Regional Banks) 63.80 is price resistance.
SMH (Semiconductors) 225.80 is price support area.
IYT (Transportation) 239 is price support.
IBB (Biotechnology) Watching for a rally towards 50-day moving average at 126 along with general market.
XRT (Retail) 70 is price support.
Twitter: @marketminute
The author may have a position in mentioned securities at the time of publication. Any opinions expressed herein are solely those of the author and do not represent the views or opinions of any other person or entity.

 Flirting With Critical Support… Again")


