The main engine of the domestic economy and stock market indices is the technology sector.
No doubt about it.
Technology stocks have lead the stock market for over two decades, so it’s always worth watching the Nasdaq indices and how they are faring. Today we provide an update.
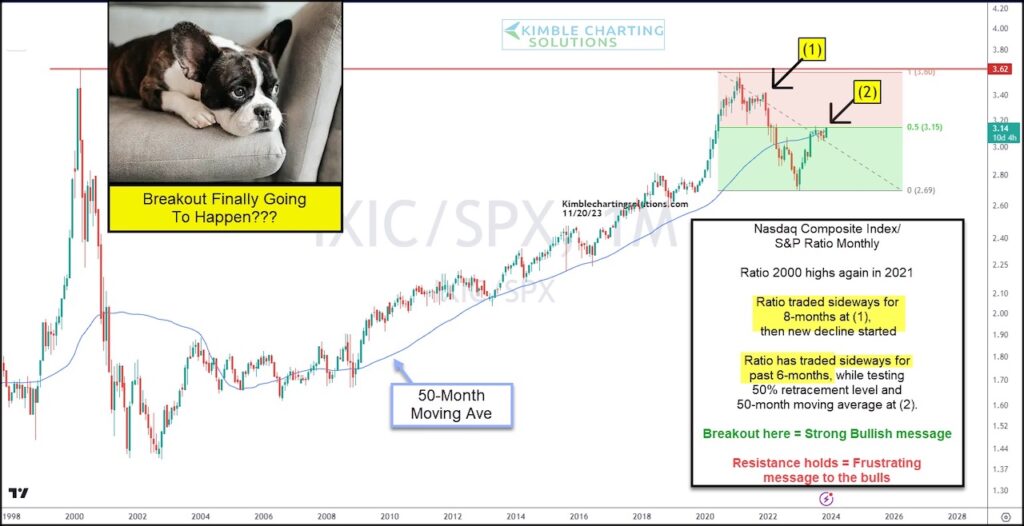
Below is a long-term chart highlighting the performance ratio of the Nasdaq Composite to the S&P 500 Index.
As you can see, the ratio traded sideways for 8 months before collapsing at (1). In late 2022, a rally developed that carried into 2023 with tech strength helping the ratio rally just past its dotted down-trend line.
But, once again, the ratio has traded sideways for the past 6 months at (2). Is this just a consolidation before a bullish breakout higher? Or heavy sideways trading that will break down again?
Big news should come from the resulting pattern. Bull market signal or bearish breakdown? Stay tuned!
Nasdaq Composite to S&P 500 “monthly” Performance Ratio Chart
Note that KimbleCharting is offering a 2 week Free trial to See It Market readers. Just send me an email to services@kimblechartingsolutions.com for details to get set up.
Twitter: @KimbleCharting
Any opinions expressed herein are solely those of the author, and do not in any way represent the views or opinions of any other person or entity.


