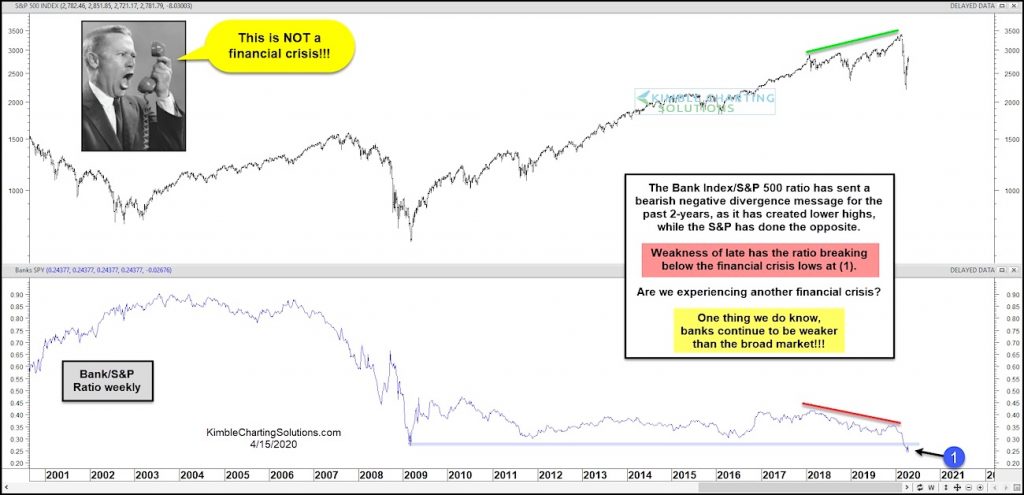
S&P 500 Index (top pane) vs Bank Index to S&P 500 Ratio (lower pane)
As most investors know, the banks play a big role in the overall economy.
Healthy banks tend to mean a healthy economy and struggling banks tend to mean an uneven or faltering economy.
In today’s chart 2-pack, we highlight the weakness in the Bank Index and what it signaled early on… and may be signaling now.
As you can see, the Bank Index to S&P 500 ratio has sent a bearish negative divergence message for the past 2 years, creating lower highs while the S&P 500 created higher highs.
After the March stock market crash, the banks have shown further weakness, with the ratio breaking below the financial crisis lows at (1).
The banks continue to be weaker than the broad market and that’s not a good thing. Bulls need to see the banks begin to outperform or they could risk giving back recent gains. Stay tuned!
Note that KimbleCharting is offering a 2 week Free trial to See It Market readers. Just send me an email to services@kimblechartingsolutions.com for details to get set up.
Twitter: @KimbleCharting
Any opinions expressed herein are solely those of the author, and do not in any way represent the views or opinions of any other person or entity.


: Showing Some Signs of Emerging Strength")
