The Semiconductors Sector ETF (SMH) has been a market leading sector for nearly two decades.
And after a brief swoon, the Semiconductors (SMH) are heating up once again.
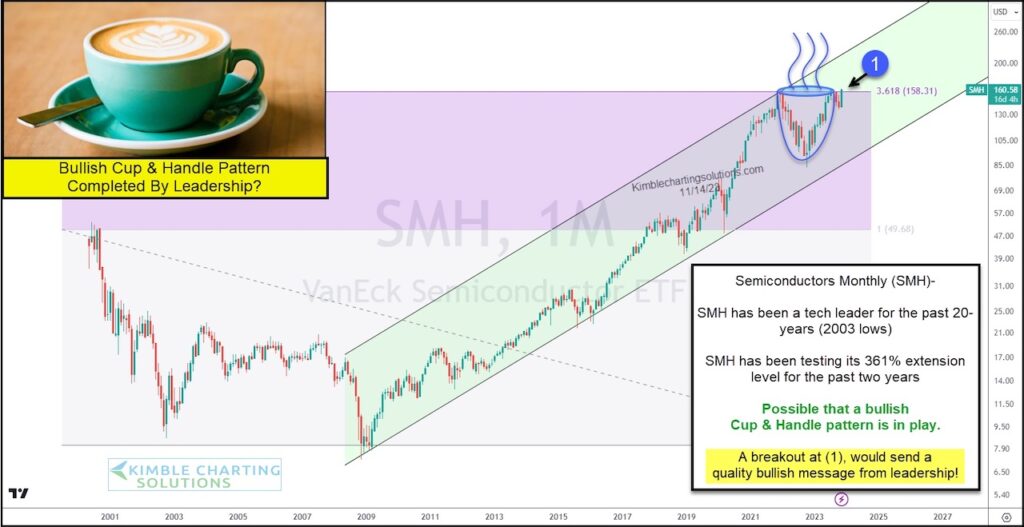
Today’s chart is a long-term “monthly” view of the SMH. As you can see, this market leading sector has been in an uptrend channel for the past 20 years!
After a brief pullback into 2022, the Semiconductors have come back with renewed strength to test the 361% Fibonacci extension level once again at (1). Better yet, a potential bullish cup and handle pattern has formed… and a breakout at (1) would send a quality bullish message from market leadership.
Time for stock bulls to rock n roll? Stay tuned!
$SMH Semiconductors Sector ETF “monthly” Chart
Note that KimbleCharting is offering a 2 week Free trial to See It Market readers. Just send me an email to services@kimblechartingsolutions.com for details to get set up.
Twitter: @KimbleCharting
Any opinions expressed herein are solely those of the author, and do not in any way represent the views or opinions of any other person or entity.


