The rise in interest rates has been meteoric, with mortgage rates reaching levels not seen in nearly 2 decades.
The 10-year US treasury bond yield is highly watched as a leading indicator and that yield has risen from near 0 (Covid) to well over 4 percent recently.
Is this historic rise in interest rates enough? Given how sensitive the stock market has been to this rise, investors sure hope so!
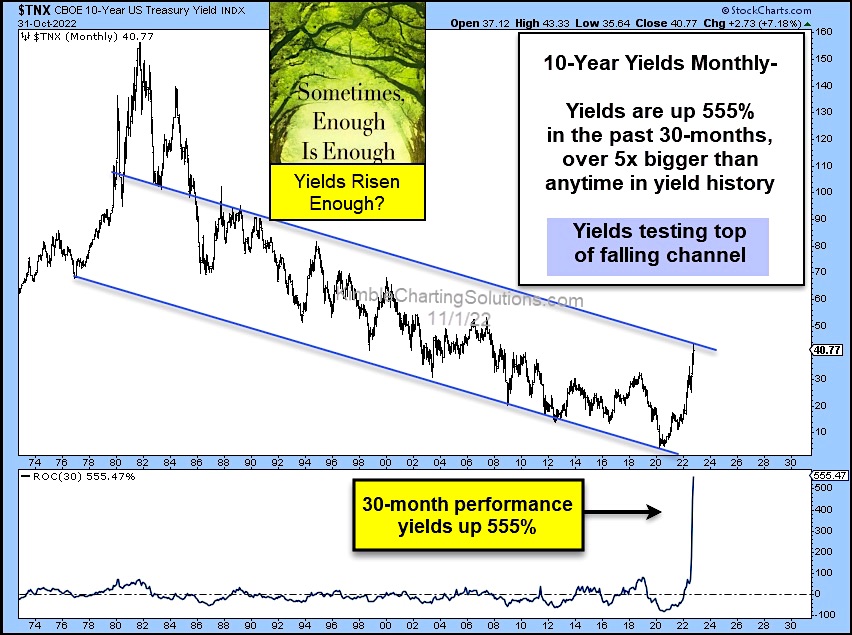
Today’s chart takes a look at the 10-Year treasury bond yield on a long-term “monthly” timeline. As you can see, rates have spiked. In fact, using the 30-month ROC (rate of change), yields are up 555% (over 5x bigger than any time in yield history).
10-year yields are also testing a long-term down trend channel that may serve as resistance.
So yields are over-heated and testing strong resistance. Will this cool off interest rates? Have bond yields risen enough? Stay tuned!
$TNX 10-Year US Treasury Bond Yield “monthly” Chart
Note that KimbleCharting is offering a 2 week Free trial to See It Market readers. Just send me an email to services@kimblechartingsolutions.com for details to get set up.
Twitter: @KimbleCharting
Any opinions expressed herein are solely those of the author, and do not in any way represent the views or opinions of any other person or entity.

: Showing Some Signs of Emerging Strength")
