You will often hear us talk about the market giving “risk on” or “risk off” signals.
In general, investors want to see “risk on” assets performing well. This includes tech stocks, growth stocks, small cap stocks, and high yield / junk bonds.
Today, we focus on junk bonds… and wonder if the rally in the Junk Bonds ETF (JNK) is over.
“The facts, Ma’am. Just the facts.”
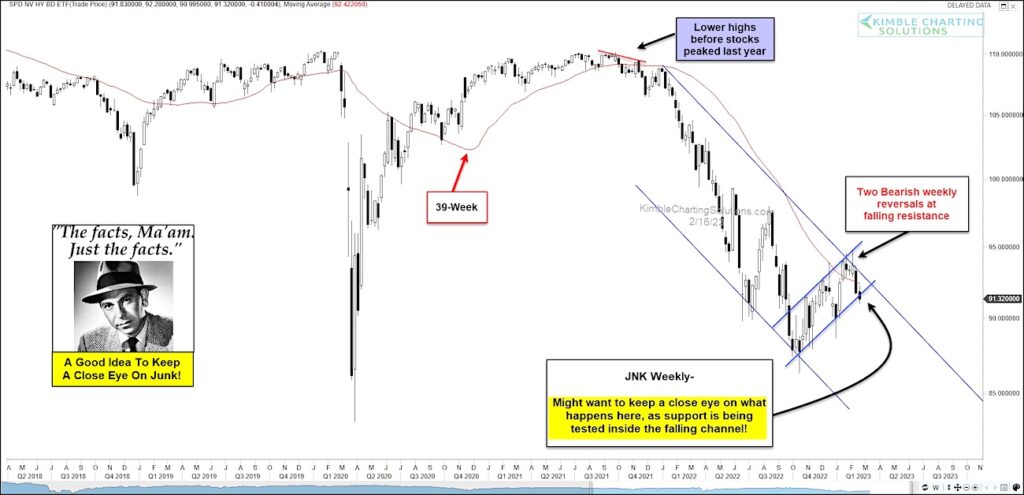
Today, we look at a “weekly” chart of the Junk Bonds ETF $JNK. As you can see, JNK made lower highs before stocks peaked last year. Fast forward to this year, and you can see that JNK created two bearish weekly reversals at resistance while declining below its 39-week moving average. It is now attempting to break it’s near-term up trend line.
Joe Friday is of the opinion that stock investors should keep a close eye on what JNK does from here! If junk bonds break down, we could see more selling across the stock market. Stay tuned!!
$JNK Junk Bonds ETF “weekly” Chart
Note that KimbleCharting is offering a 2 week Free trial to See It Market readers. Just send me an email to services@kimblechartingsolutions.com for details to get set up.
Twitter: @KimbleCharting
Any opinions expressed herein are solely those of the author, and do not in any way represent the views or opinions of any other person or entity.


: Showing Some Signs of Emerging Strength")
