There are several popular indicators that investors use to gauge the health of the stock market.
One that I like to follow is the SPDR Junk Bonds ETF (NYSEARCA:JNK). This index provides insight into the current appetite of investors (i.e. “risk-on” or “risk-off”).
For instance, stocks and the S&P 500 (NYSEARCA:SPY) typically do well when investors have an appetite for risk. So stock market bulls want to see the Junk Bonds ETF going higher.
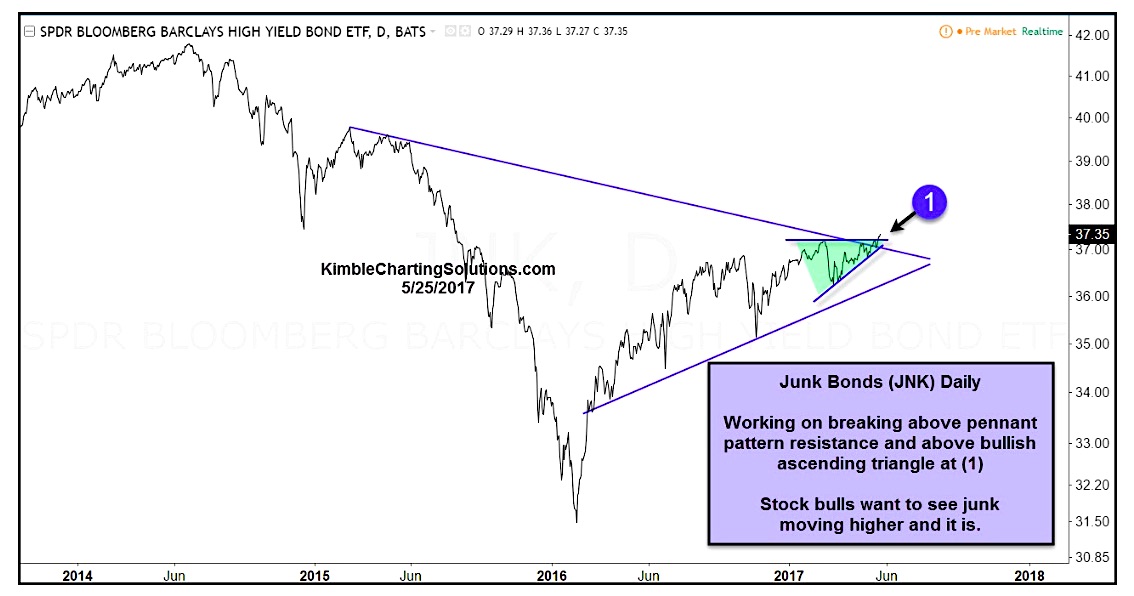
The chart below is a 3 year look back at the Junk Bonds ETF (JNK). As you can see, JNK hit a low in February 2016 and has been moving higher since.
But the price action of JNK in 2017 has taken the shape of a bullish ascending triangle (flat top and rising bottoms). This comes just as the ETF is also testing its downtrend line from the early 2015 highs. Is a dual breakout in the works?
ALSO READ: Is The US Dollar Breaking Down?
Historically this type of price action is NOT a concerning message for the stock market. More concerning would be a break back below both lower blue support lines.
Thanks for reading and have a great week!
Twitter: @KimbleCharting
Any opinions expressed herein are solely those of the author, and do not in any way represent the views or opinions of any other person or entity.


