The collapse in the treasury bond market has been epic.
But a recent bounce in the 20+ Year Treasury Bond ETF (TLT) has offered some hope to bond investors… but only if it can move above a key price level.
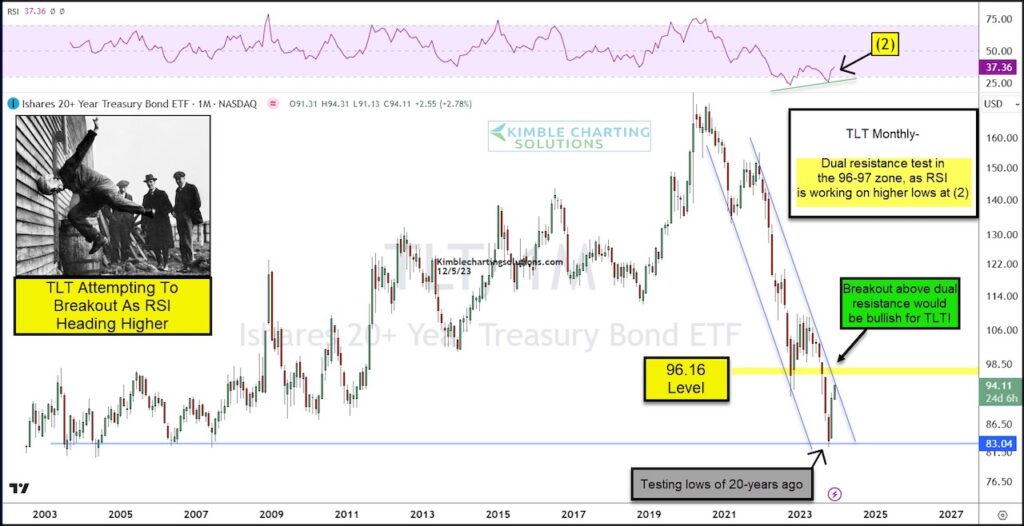
Today we look at a long-term “monthly” chart of the TLT.
As you can see, the crash in treasury bond prices has been ugly. And price has traded in a falling downtrend channel. TLT also tested its 20-year lows. Yikes!
So where’s the hope?
Well, TLT has rallied over the past few months and is testing a critical dual resistance level near 96-97. This price area makes overhead falling resistance as well as lateral resistance. Its RSI is also making higher lows and attempting to trend higher at (2).
In my humble opinion, this is a very important breakout test for the hard-hit TLT. And should it break out, it would be quite bullish. Stay tuned!
$TLT 20+ Year Treasury Bond ETF Chart
Note that KimbleCharting is offering a 2 week Free trial to See It Market readers. Just send me an email to services@kimblechartingsolutions.com for details to get set up.
Twitter: @KimbleCharting
Any opinions expressed herein are solely those of the author, and do not in any way represent the views or opinions of any other person or entity.


