As global equity markets continue a strong move higher into Options Expiration week, something seems to be missing. Yup, Crude Oil prices aren’t playing along. In fact, Crude Oil has been mired in a steady grind lower, unaffected by the wild swing in equities. So what’s up with the black gold?
Well, relative weakness in Crude Oil prices seem to be telling investors a couple things:
- The short-term rush higher in equity prices may be fleeting.
- Crude Oil isn’t quite ready for prime time… yet.
While equities have made a u-turn higher into OpEx, Crude Oil prices have been asleep at the wheel:
Crude Oil prices vs the S&P 500
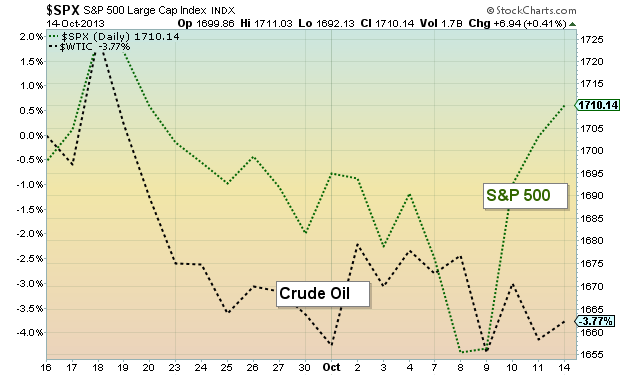
Options expiration will likely provide the impetus for the major equity indices to test or record all-time highs. But, if Crude Oil prices don’t perk up soon, it may be difficult for equities to continue this momentous move much beyond options expiration.
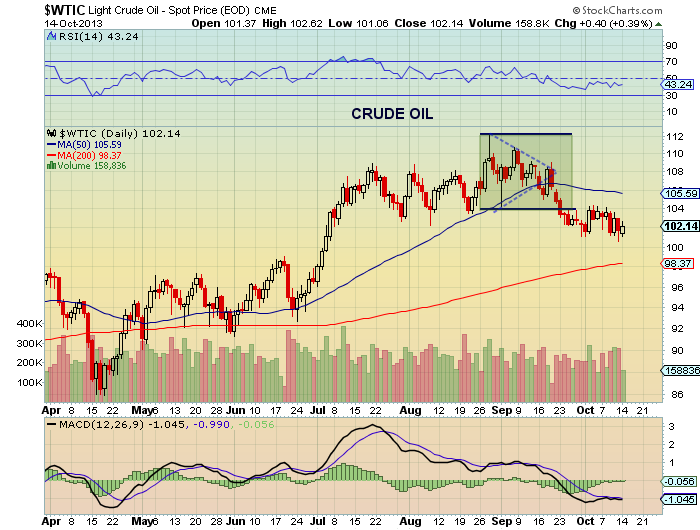
Speaking of short-term, here is a chart of Crude Oil that highlights the recent chop lower from the August highs.
Crude Oil Daily Chart
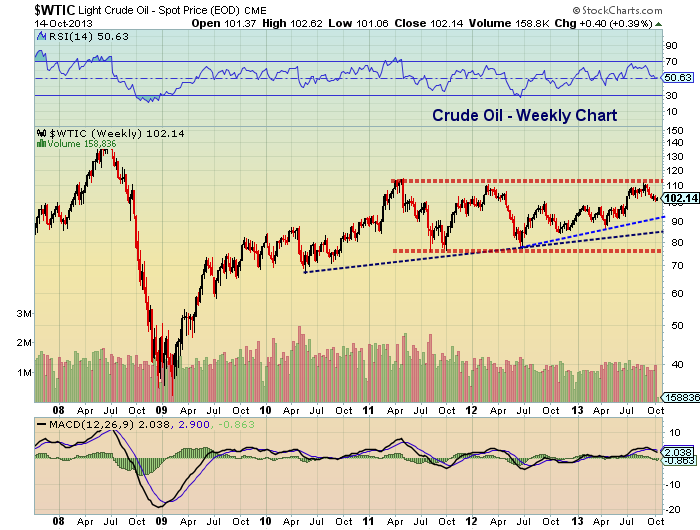
And considering that Crude Oil prices peaked in late August, I thought it would be a good idea to put up a weekly chart for some perspective (see below). First and foremost, it should be noted that the intermediate term trend is not bearish. Looks more like bullish basing: Both intermediate term trend lines are in tact and price is in the upper half of the channel. As well, Crude is holding above 4 major intermediate support levels:
- The 200 day moving average (dma) around $98
- The 15 month uptrend line around $92
- The 3+ year trend line from the 2010 lows around $86
- The lower channel support around $77.
While the 200 dma holds some psychological weight, I’m more concerned about the recent trend lines at $92, and perhaps $86.
Crude Oil Weekly Chart
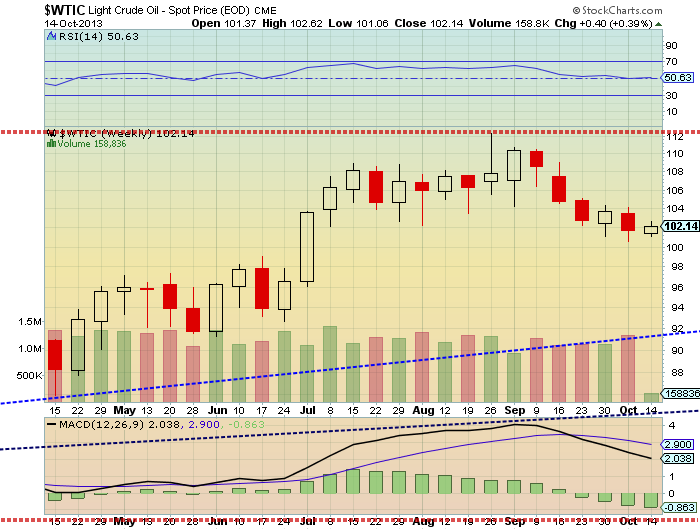
Zooming in on the weekly chart for Crude Oil, my eyes are drawn to the nasty reversal candlestick recorded in late August; that long wick foretold the recent rough patch in Crude Oil prices. And with the weekly buy setup on 5 out of 9, Crude may continue to be pressured. Note that a continuation of this setup would place a Crude Oil bottom in early Novmember… And barring a complete collapse, this pullback should present a tradable buying opportunity.
Crude Oil Weekly “Zoom” Chart
Trade safe, trade disciplined.
Twitter: @andrewnyquist
No position in any of the mentioned securities at the time of publication. Any opinions expressed herein are solely those of the author, and do not in any way represent the views or opinions of any other person or entity.


: Showing Some Signs of Emerging Strength")
