The past few years have seen interest rates soar. But perhaps it’s a case of too far, too fast.
Today we look at interest rates in the form of treasury bond yields. And more specifically, the 30-year treasury bond yield.
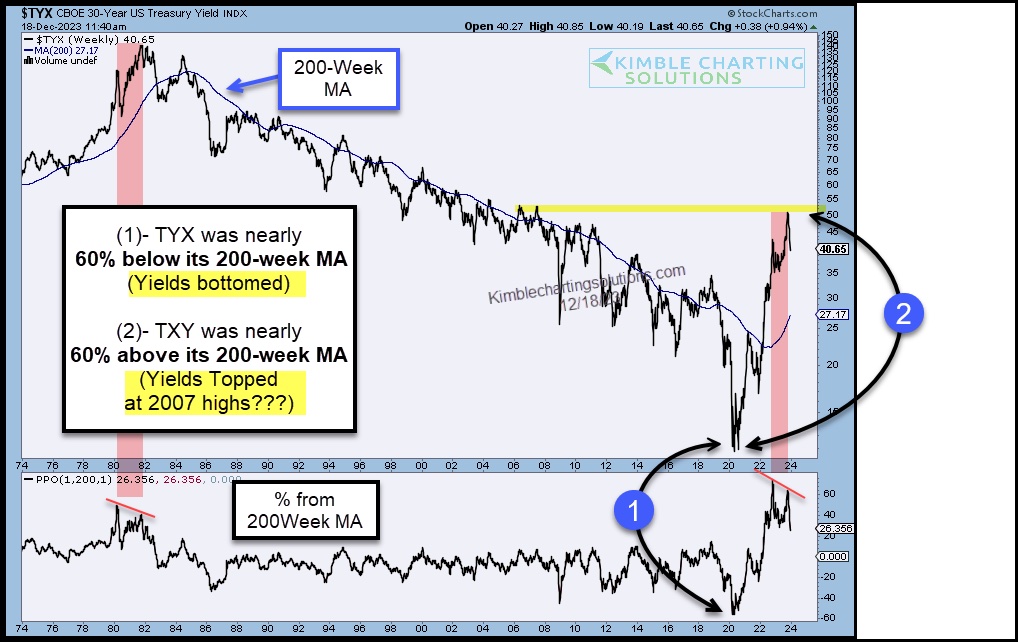
As you can see, the 30-year bond yield has been in a downtrend since peaking in the early 1980’s. But the recent rally may have ended that.
Needless to say, yields have either burned too hot or too cold a few times over this stretch of time. So how do we measure this?
Well, when yields have been a great distance above or below the 200-week moving average, long-term inflection points come into play.
First, it was the early 80’s when yields got 60% above its 200-day MA. Then it was the covid meltdown at (1) when yields fell sharply to 60% below the MA. And now yields have popped 60% above the MA at (2).
And, once again, yields are beginning to fall. Is it time for yields (interest rates) to come back down to earth? Stay tuned!
$TYX 30-Year US Treasury Bond Yield “weekly” Chart
Note that KimbleCharting is offering a 2 week Free trial to See It Market readers. Just send me an email to services@kimblechartingsolutions.com for details to get set up.
Twitter: @KimbleCharting
Any opinions expressed herein are solely those of the author, and do not in any way represent the views or opinions of any other person or entity.

: Worrisome to Broader Market?")

