Most traders and active investors know that Apple’s stock (NASDAQ: AAPL) has fallen during the ongoing stock market correction.
But did you know that Monday’s lows marked a nearly 30 percent decline (from the October highs to December lows). Wow, 30 percent.
So does that make it a good buy? Is it time to rush out and buy Apple’s stock?
Perhaps. But as an active investor and swing trader, I want to caution you on time frames. Time frames are key discipline to understand if one is to be successful in this field.
Typically, blue chips are “on sale” during pullbacks / corrections in a bull market. So it’s pretty easy to say “yeah, it’s a good buy here”. But the bull market is nearly 10 years old… and it’s always prudent to create a plan.
Today, we’ll look at Apple (AAPL) over two timeframes: the Daily and Weekly charts.
Note that the following MarketSmith charts are built with Investors Business Daily’s charting suite. I am an Investors Business Daily (IBD) partner and promote the use of their products. The entire platform offers a good mix of technical and fundamental data.
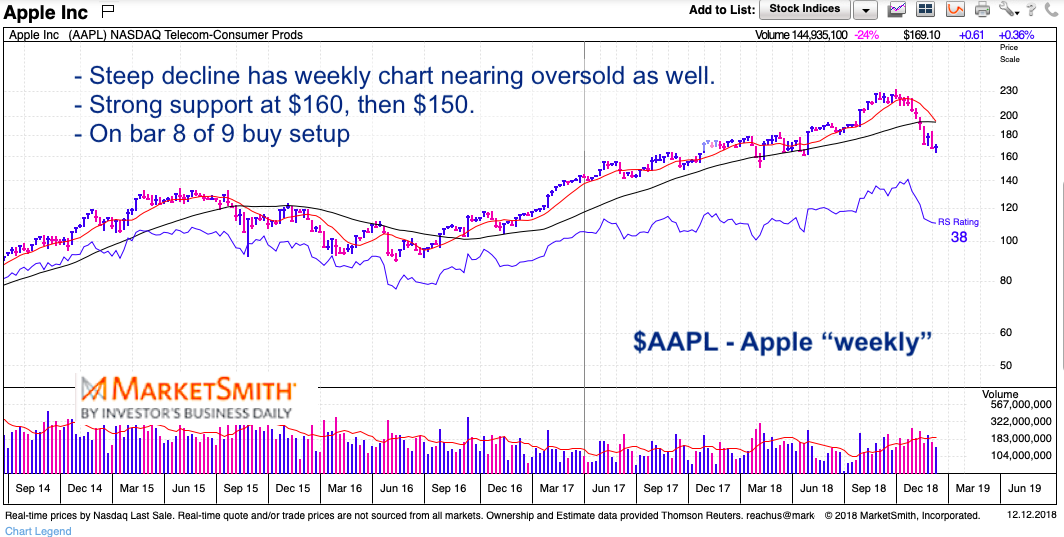
$AAPL Apple “weekly” Stock Chart
Let’s start with the weekly chart to get a bigger picture of AAPL trends and price action. Then we’ll zoom to see if there are any near-term trading setups.
On the weekly chart we can see the multi-week decline. Considering Apple’s market cap and importance to investors, it’s fascinating that the broad indexes aren’t down more. But that’s another story.
Apple is getting oversold here. And it’s on bar 8 of a weekly 9 Demark buy setup. This should lead to a bounce in Apple’s stock price beginning sometime over the next week or two. The largest bank of near-term support resides at $160. This is followed by $150, should AAPL’s slide last longer than one thinks.
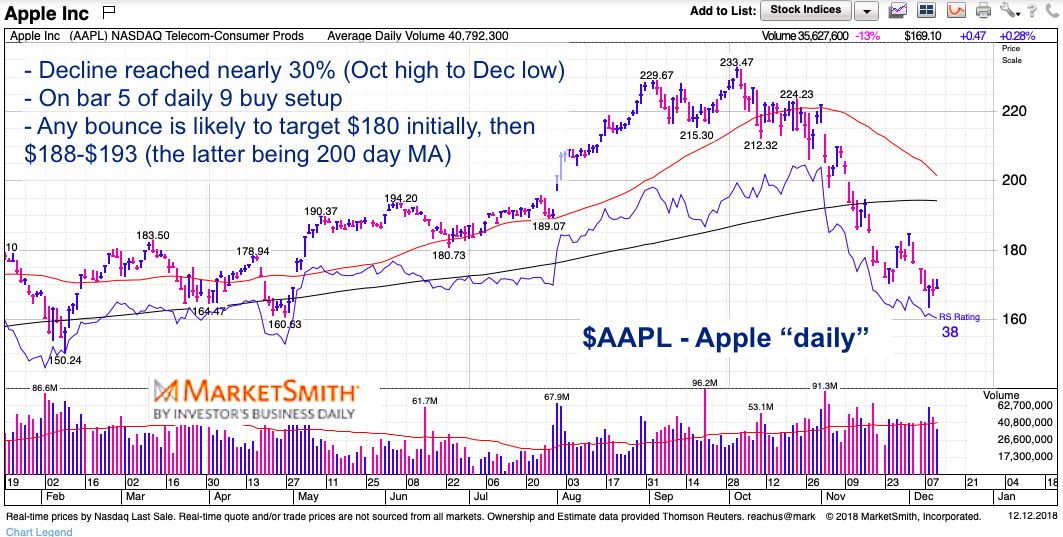
$AAPL Apple “daily” Stock Chart
The daily chart highlights the steep selloff and shows how quickly the tables can turn on strong stock.
The daily chart is also oversold. It is currently on bar 5 (Wednesday) of a daily 9 Demark buy setup. If this continues, it would complete it’s buy setup early next week. There is technical damage from the nearly 70 point selloff so it’s probably wise to shorten your time frames.
Bounce/Rally targets are $180 (initially) and $188-$193 after that. The latter zone is where the 200 day moving average is (currently $193). The 50 day moving average (currency $200) is falling sharply and may cross the 200 day moving average soon.
As an active investor, I always layer in my buys and sells (example: 1/3, 1/3, 1/3). And it’s always good to be patient, especially on the buy side. It’s important to note that you don’t need to have a “full” position. If only one or two of your 1/3 buys get filled, that’s fine. It means you’re in the green (or will be shortly) and that’s a better position to be in.
If/When $AAPL bounces, we can evaluate the price action to see if durable low is in… or if another leg lower is necessary before heading higher again. Follow your plan and stay disciplined.
Twitter: @andrewnyquist
The author does not have a position in mentioned securities at the time of publication. Any opinions expressed herein are solely those of the author, and do not in any way represent the views or opinions of any other person or entity.


: Showing Some Signs of Emerging Strength")
