 By Andrew Nyquist
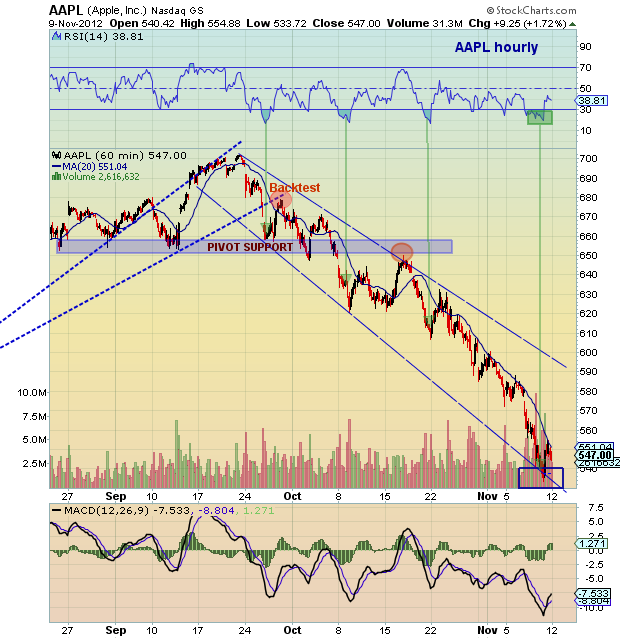
Well, the Apple (AAPL) has fallen from the tree. The recent “bear” plunge from over $700 to $533 has been unrelenting and torturing for longs… and may not be over.
That said, the drop did push the hourly RSI well below 30 to levels indicative of the bounce we are now seeing (see hourly chart below). I am long for a short-term trade with an average price of 545. I am looking for a bounce to 560-565 (just below the near term down trend line).
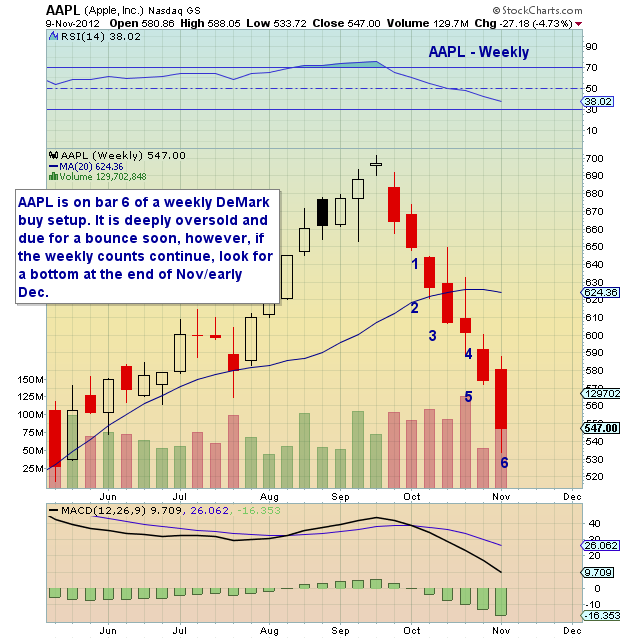
But this doesn’t mean that a lasting bottom is in place – not with this much damage. Time heals, so caution is still advised (i.e. stops). Note that the DeMark weekly set up count is on bar 7 (of 9) this week. So, should the set up continue, it portends a late November bottom (similar to the Nasdaq 100).
Trade safe, trade disciplined.
Apple (AAPL) stock chart from November 9, 2012. AAPL technical support and resistance levels with trend lines and technical analysis. AAPL DeMark set up count and analysis.
———————————————————
Twitter: @andrewnyquist and @seeitmarket Facebook: See It Market
Position in AAPL at the time of publication.
Any opinions expressed herein are solely those of the author, and do not in any way represent the views or opinions of his employer or any other person or entity.


