 Ahead of Q3 earnings after the bell today, Apple (AAPL) is setting up as a technical cliffhanger across multiple timeframes.
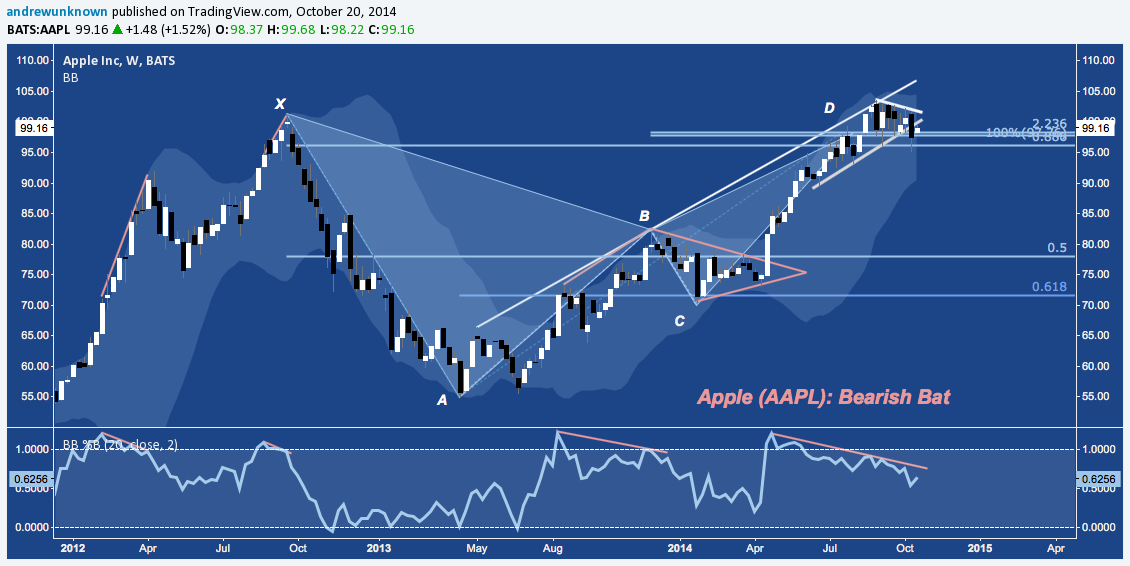
On a weekly timeframe, AAPL has just broken down from a Symmetrical Triangle back into a harmonic Bearish Bat potential reversal zone (at D, below) it broke above in August. Overthrows above broad-ranging harmonic patterns like this are common. However, the break below Q2/Q3 2014’s rising trend line support coupled with an escalating 6-month negative divergence (see %B, bottom panel) give the weekly chart a bit of a bearish tilt heading into Apple earnings.
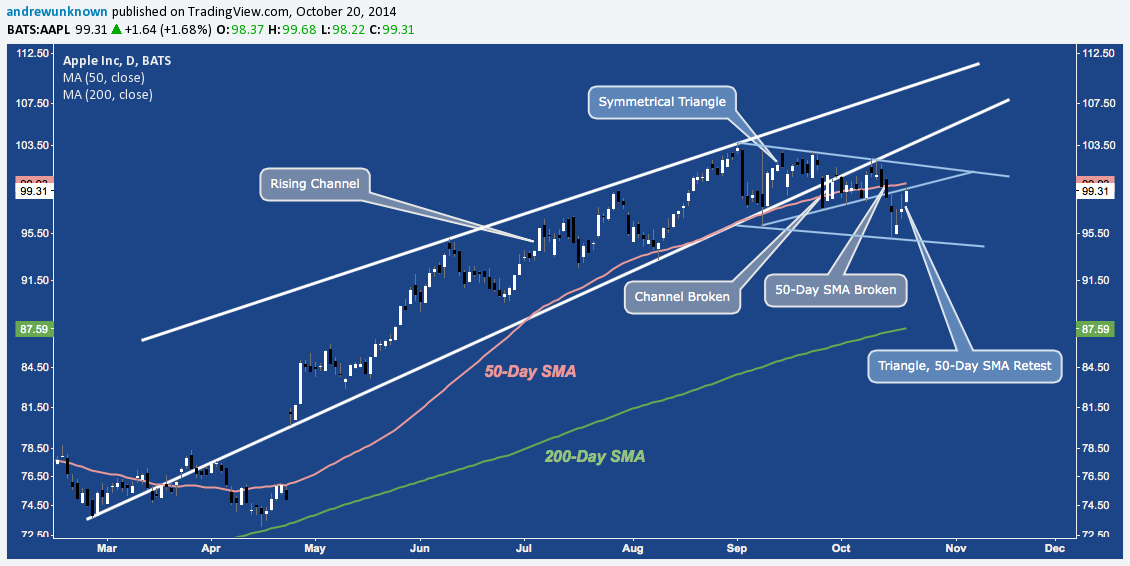
Zooming into a Daily timeframe, basic trend line and moving average analysis reaches a similar conclusion. In late September, Apple broke down from the Rising Channel (white) underway since April after turning sideways through a Symmetrical Triangle after installing it’s split-adjusted all-time high in late August. Along with the symmetrical triangle breakdown, AAPL did break below it’s 50-Day SMA, where it has remained for multiple sessions for the first time since April. The rally since last Wednesday’s bottom has brought the stock back to retest both the 50-Day SMA and Symmetrical Triangle range. This lower low satisfied the basic criteria for a flag (parallel blue lines) that could set the stage for a measured move higher; but not until multiple levels if resistance are broken and new ATHs attained.
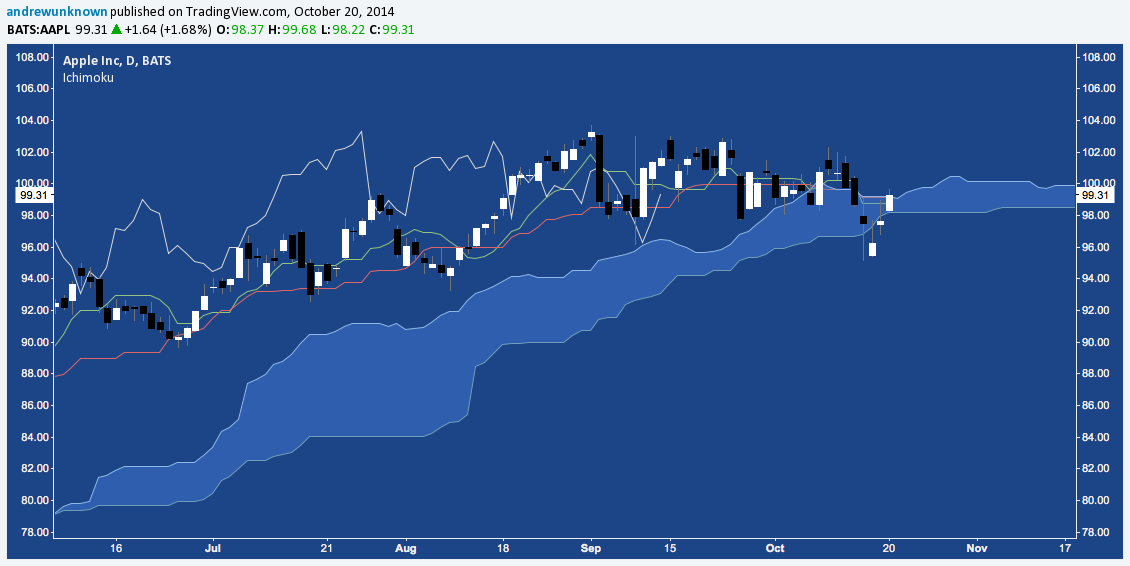
Ichimoku Kinko Hyo also depicts AAPL as bearish-to-neutral. Opening beneath the kumo (cloud) last Thursday, leading into today’s earnings release AAPL has recovered back into the cloud to test it’s upper boundary (Senkou Span A) as resistance. Tenkan-Sen (green) crossed beneath Kijun-Sen (red) last week – a modestly bearish development, but both lines remain inside the cloud. Finally, price is just below where it was at Chikou Span (gray) 26 trading days ago, adding to the slight bearish orientation. Traders will want to see price recover above the cloud (an very easy feat from here) followed by Tenkan and Kijun to affirm Apple’s trend higher. This analysis highlights how pivotal the Apple earnings report may be for traders.
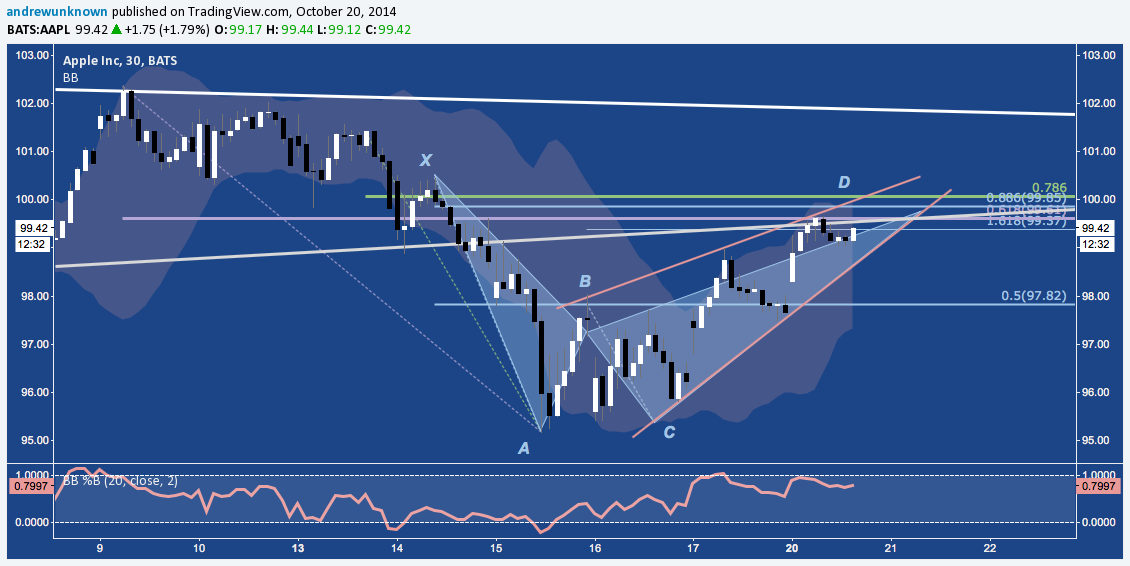
Cloud resistance also coincides with major short-term fibonacci cluster resistance between $99-100, the location of the harmonic Bearish Bat pattern that has developed on AAPL over the last several trading sessions, most recently forming a Rising Wedge since last week’s low near $95.25. As the chart below depicts, this is also where longer-term (referred to above) rising trend line support-turned-resistance (diagonal white line) runs, as well. Is Apple about to break higher; or has the Bearish Bat simply built out a corrective rally throwback to the Symmetrical Triangle before turning lower?
Apple’s primary trend remains higher, which must be given the benefit of the doubt. With technical problems piling up on multiple timeframes as the stock struggles to break late 2012’s ATHs (pre-split near $705), a major technical decision is just ahead. Will a bearish reversal affirm these outstanding problems; or will a bullish thrust on positive Apple earnings negate them all, propelling Apple to fresh highs?
Trade ‘Em Well.
Twitter: @andrewunknown
Andrew holds no exposure to securities/instruments mentioned at the time of publication. Commentary provided in the above text and video is for educational purposes only and in no way constitutes trading or investment advice.


