When a stock’s price is going lower, and a momentum indicator like RSI is going higher, you have what’s called a “bullish momentum divergence”. This is often a sign of downtrend exhaustion and can be a great leading indicator for future rallies.
As the major averages have begun to rally in the new year, we are finding a plethora of bullish divergences on individual stocks and ETFs. Does this suggest that conditions are improving for risk assets? We think it does.
Combine these bullish momentum divergences with encouraging breadth data, and then we have a very constructive picture emerging for stocks.
For example, here’s the percent of stocks above their key moving averages.
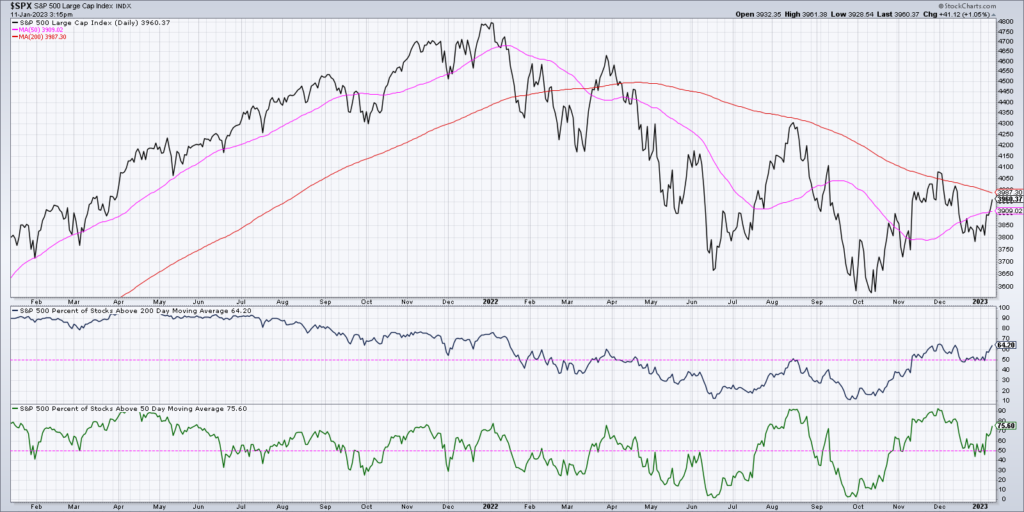
You’ll notice that about 64% of the S&P 500 index members remain above their 200-day moving average. Just over 75% of the S&P 500 stocks are above their 50-day moving average.
Note the horizontal lines right at the 50% level for each indicator. In my experience, as long as these breadth indicators remain above this key 50% threshold, then conditions remain fairly bullish.
So as the S&P 500 pulled back in December, both of these indicators stayed above 50%. While breadth conditions remain bullish, it suggests that there is broad participation in the upswing and plenty of opportunities to outperform the benchmarks.
Given the strong breadth conditions, I take special notice of charts like Amazon which are indicating that the bearish conditions in 2022 may finally be alleviated.
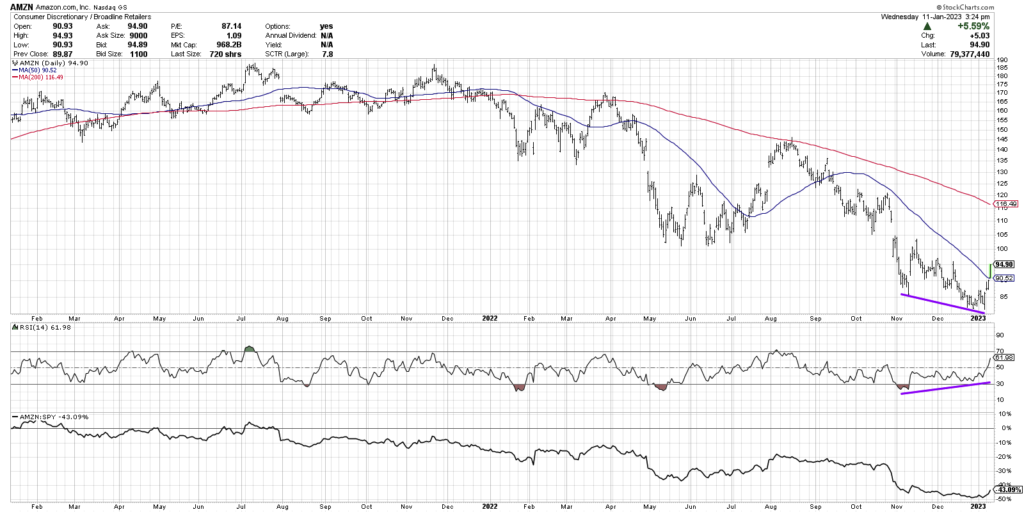
Today we’ll break down bullish momentum divergence approach using three examples: Amazon (AMZN), Generac (GNRC) and the Communication Services ETF (XLC).
- How can you use these divergences as a leading indicator of improving momentum characteristics?
- How should you incorporate other technical indicators like support and resistance levels to validate these buy signals?
- What are the key levels to watch for AMZN, GNRC and XLC?
VIDEO: Is Amazon Stock AMZN Showing Bullish Divergence?
Twitter: @DKellerCMT
The author may have positions in mentioned securities at the time of publication. Any opinions expressed herein are solely those of the author, and do not in any way represent the views or opinions of any other person or entity.


