Alibaba (BABA) impressed most market participants with its strong IPO pop, but then declined into the low $80’s. A nearly 50 percent rise then took place from mid-October to the November peak at $120. Many were expecting some kind of pullback in Alibaba shares, and that indeed took place through the balance of November and into December, bottoming at $101.20 just a few days ago.
As you can see in the below chart, the December 9 low is critical support for Alibaba bulls.
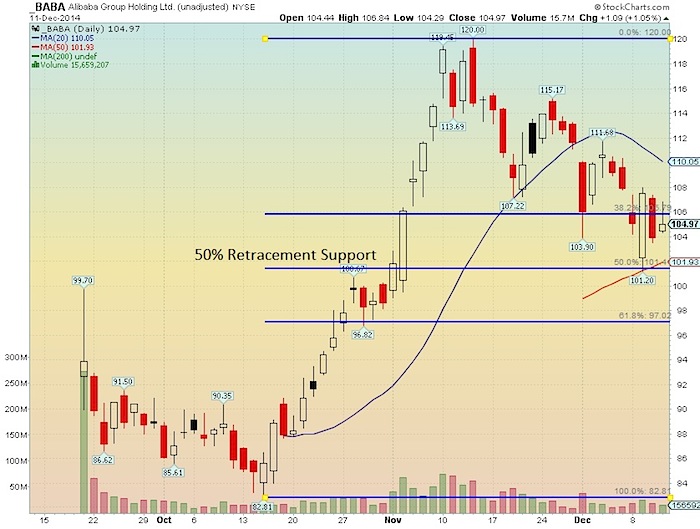
Alibaba (BABA) Daily Stock Chart

Note that there was a confluence of support near $101:
- Prior peak from October ($100.67)
- Newly formed 50-day moving average ($101.23)
- 50% retracement of the October to November rally ($101.41)
Also notice the bullish nature in the volume – it increased during the rally, then declined during the pullback. This isn’t always a perfect science, but it does offer some insights into the behavior of investors.
Alibaba Stock Chart – Fibonacci Retracement Levels
Should the $101.20 low hold, it would imply a measured move target of $138 for Alibaba shares. Bulls would like to see BABA clear the downtrend resistance line off the November peak to support the case for a new leg higher. Thanks for reading.
Follow Mike on Twitter: @MikeZaccardi
No position in any of the mentioned securities at the time of publication. Any opinions expressed herein are solely those of the author, and do not in any way represent the views or opinions of any other person or entity.


: Showing Some Signs of Emerging Strength")
