In 2022, the economy has slowed, inflation has risen, and political and geopolitical tensions have heightened.
This has had a direct effect on consumer behavior. Namely traveling and taking airlines on trips.
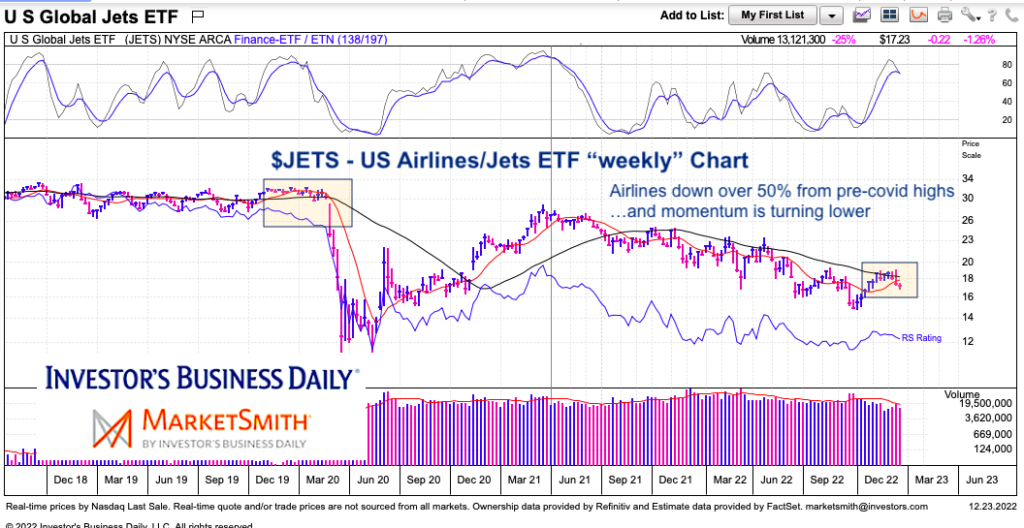
And, you guessed it, this has hit the airlines stocks. Today we take a quick look at a long-term chart of the Airlines ETF $JETS, which has been cut in half since we first learned of the Coronavirus/Covid.
Note that the following MarketSmith charts are built with Investors Business Daily’s product suite.
I am an Investors Business Daily (IBD) partner and promote the use of their products. The entire platform offers a good mix of tools, education, and technical and fundamental data.
$JETS U.S. Airlines/Jets Sector ETF “weekly” Chart
As you can see, JETS tried to dig its way out of the coronavirus crash only to stall out mid-way through 2021 and steadily decline over the past 18 months. Currently, JETS is trading below its 10 and 40-week moving averages while momentum is turning lower. A retest of the early October low appears to be underway.
Bulls will need that low to hold. This picture will remain bearish until price clears (and holds) the 10-week moving average.
Twitter: @andrewnyquist
The author may have a position in mentioned securities at the time of publication. Any opinions expressed herein are solely those of the author, and do not in any way represent the views or opinions of any other person or entity.


