Semiconductor stocks have been leading technology stocks higher. And today’s Semi stock has been red hot: Advanced Micro Devices (AMD)
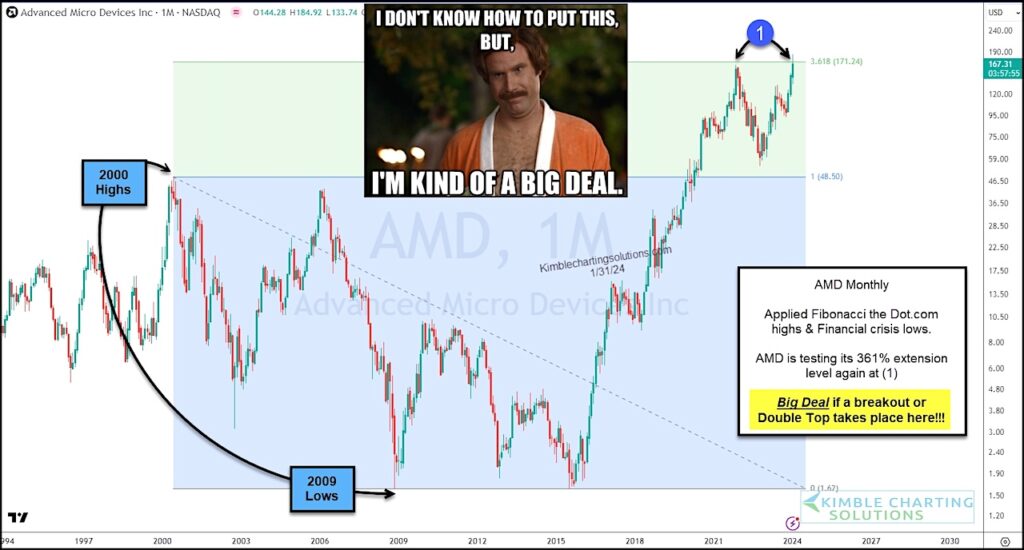
As you can see on the “monthly” chart below, AMD has been ripping higher in recent months.
But it’s important to note the shaded areas. The blue shade highlights price from the 2000 dot-com high to the 2009 financial crisis low. This would be the 0 to 100% blue shade area for Applied Fibonacci purposes. The green shade area highlights price all the way up to the 161% Fibonacci line. Note that this is where price stopped on a dime in late 2021 – at (1) – before retesting the 100% breakout level.
Well the latest rally has taken AMD back to the 161% Fibonacci level at (1) and the stock is attempting to break out above the 161% level.
Will we see follow through buying for a decisive breakout? Or will price pullback and create a double top for this market leader.
In my humble opinion, it’s kind of a “Big Deal” what happens to this red hot semiconductor stock at (1)!!!
$AMD Advanced Micro Devices “monthly” Stock Chart
Note that KimbleCharting is offering a 2 week Free trial to See It Market readers. Just send me an email to services@kimblechartingsolutions.com for details to get set up.
Twitter: @KimbleCharting
The author may have a position in mentioned securities. Any opinions expressed herein are solely those of the author, and do not in any way represent the views or opinions of any other person or entity.
: Cup (and Maybe Handle) Watch")
 Trading Near Top Of Price Range")
 Reaches Important Price Support")