Over the past couple of months, I have covered the prospects for Apple stock (AAPL) from an active investing viewpoint, highlighting important AAPL technical support and resistance levels for traders.
The idea behind these posts (and any other chartology’s) isn’t to “nail” each move, but rather to offer up the parameters for risk discipline that set up each move.
And in the process, hopefully active investors will learn something new about ways one can define AAPL technical support and resistance. Note that Andrew Kassen also wrote a solid AAPL chart post recently as well.
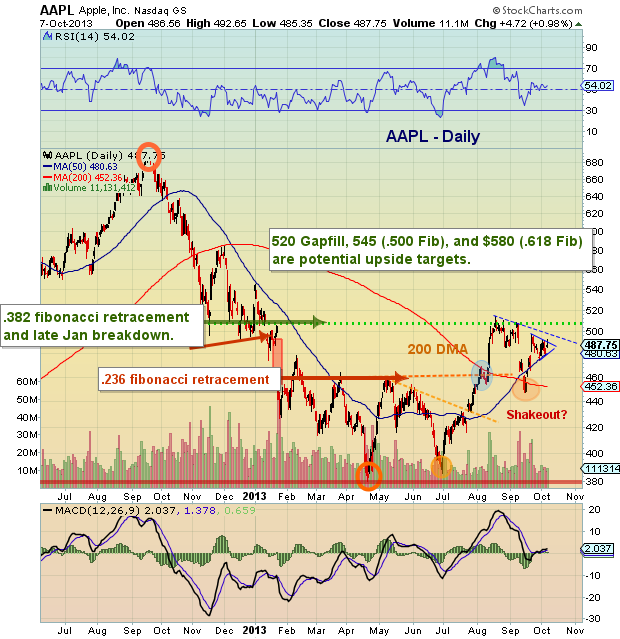
Okay, let’s get to the charts. From a macro perspective, Apple stock is finding technical support at the 50 day moving average and resistance at the .382 Fibonacci retracement level (see macro chart). The recent swing lower looks like a “shakeout” and active investors should find out soon how strong the swing higher (out of the shakeout) is. This recent move higher has formed a flag formation that bulls would like to see resolve higher.
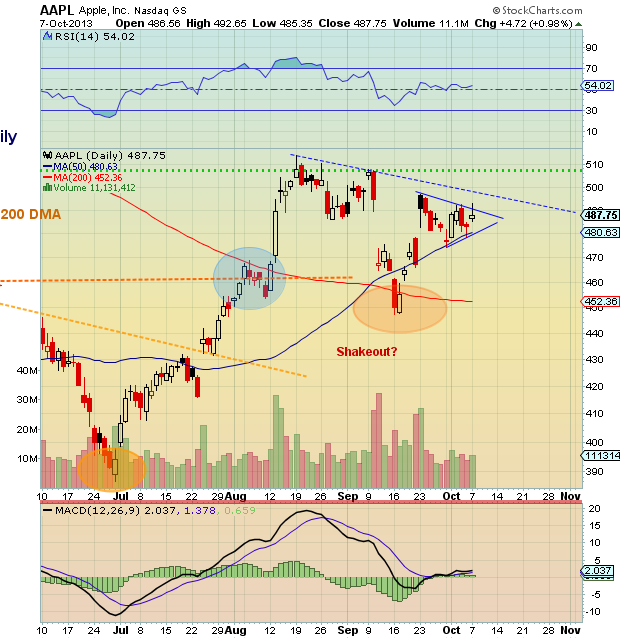
A move above the downtrend line should see follow through, while a move below $480 would weaken the setup. See the “zoom” chart below for near-term AAPL technical analysis.
Trade safe. Trade disciplined.
AAPL technical support and resistance charts
AAPL Macro Chart
 AAPL “zoom” chart
Twitter: @andrewnyquist
No position in any of the mentioned securities at the time of publication. Any opinions expressed herein are solely those of the author, and do not in any way represent the views or opinions of any other person or entity.
: Worrisome to Broader Market?")

: Important Breakout Retest")
