 While US Equity Markets continue to make new all-time highs, European and Japanese equity markets are hovering just below their May highs. As much as this divergence is a sign of strength for US equities, it is also be a sign that Europe and Japan are still correcting and navigating through time and price. Of the two, I find the Japanese Nikkei 225 to be the most fascinating, as much of the early year euphoria has been replaced by a wide-ranging, volatile pullback that is entangled in politics and monetary policy questions. That said, I want to focus on some key support and resistance levels, as well as a potential Nikkei price target, should the index continue its correction through price.
After an historic 7 month run from October to May (tracking nearing 90 percent gains, no less), the Nikkei 225 gave way to parabolic pressures, falling nearly 9 percent from intraday high to low on May 23rd alone. This started a stealth bear market that the index has recently been crawling back from since mid-June. Let’s take a quick look at the chart and try to highlight a current corrective pattern (and potential Nikkei price target), as well as a scenario that would disrupt this pattern (and likely see the bulls dancing again).
First and foremost, note that the chart below is an EOD chart, and for some reason StockCharts has not pulled in last nights session (which was up over 300 points – currently at 14,005.77). Assuming there is more strength to this rally, investors would be wise to note the open gaps overhead. These will serve as magnets should the Nikkei look to test the “lower” highs it made in July. Note that those highs also coincide with the big “B” on the chart. This is important because the bearish corrective path could be setup for an A-B-C measured move. This would mean that the highs recorded in July would need to hold as resistance and the subsequent downturn would be equal to the initial drop from the May highs to the June lows (“A”). This would yield a Nikkei price target of roughly 11500, give or take a couple hundred points. This is just below the 200 day moving average, and just above the .618 Fibonacci retracement of the Oct-May bull run at roughly 11400.
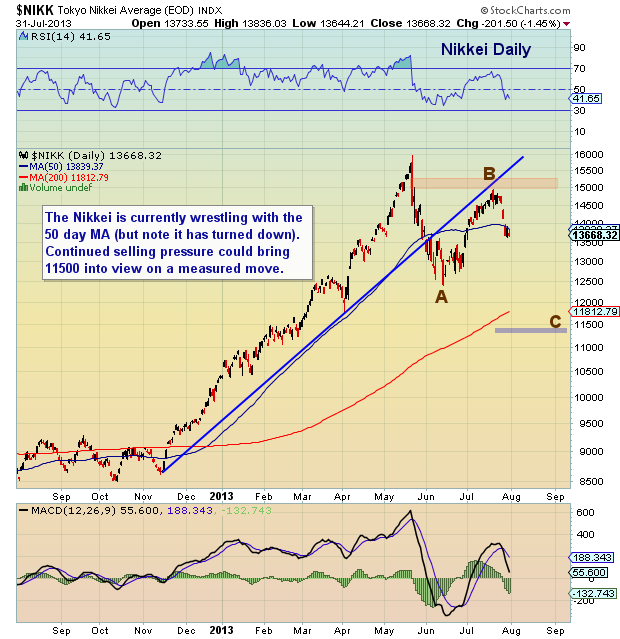 As mentioned above, this A-B-C measured move pattern would be offset by any move in price above the July highs. So the lower highs at point “B” will be important to watch over the near-term. Note that I mention this pattern more as an observation. I do not have a position in the Nikkei, but the divergence with US equities is interesting and bears watching. Thanks for reading.
Twitter: @andrewnyquist and @seeitmarket
No position in any of the mentioned securities at the time of publication.


