The recent volatility, like all volatility events, has brought some traders a fortune and others pain.
The ability to identify volatility regimes is paramount!
Correct identification of volatility shifts gives one the ability to adjust size, turn strategies off, enable hedging strategies, etc.
Ideally, a trader should have strategies for every market regime. If one can identify which regime and price action characteristics are likely (or unlikely) then plenty of stress can be removed and a certain level of robustness is added to the trader’s portfolio.
In this post, I want to discuss four ‘volatility identifiers’ that can hopefully be used to either avoid or capitalize on the next volatility event.
These have been powerful indicators to add to trading systems to help decide when on/off, filtering and of course sizing.
Are they a be all end all? No.
Are they predictive? No.
Are they a holy grail? No.
Should you ignore them? No!
I will only examine these volatility regimes based upon tomorrow’s range and tomorrow’s return. They can of course be expanded to look at 5 days forward, 20 days forward, etc. but this is left up to the reader.
Plotted below is how these volatility identifiers affect the S&P 500’s next day range and return. The X-axis is the volatility identifier and the Y Axis is the S&P 500 range (or return) for the next day.
In short, the level of these volatility identifiers has a BIG impact on what you can expect for tomorrow’s session and thus your trading systems can/should take a look to see if these can help improve performance or even alert to when some strategies should be ‘offline’!
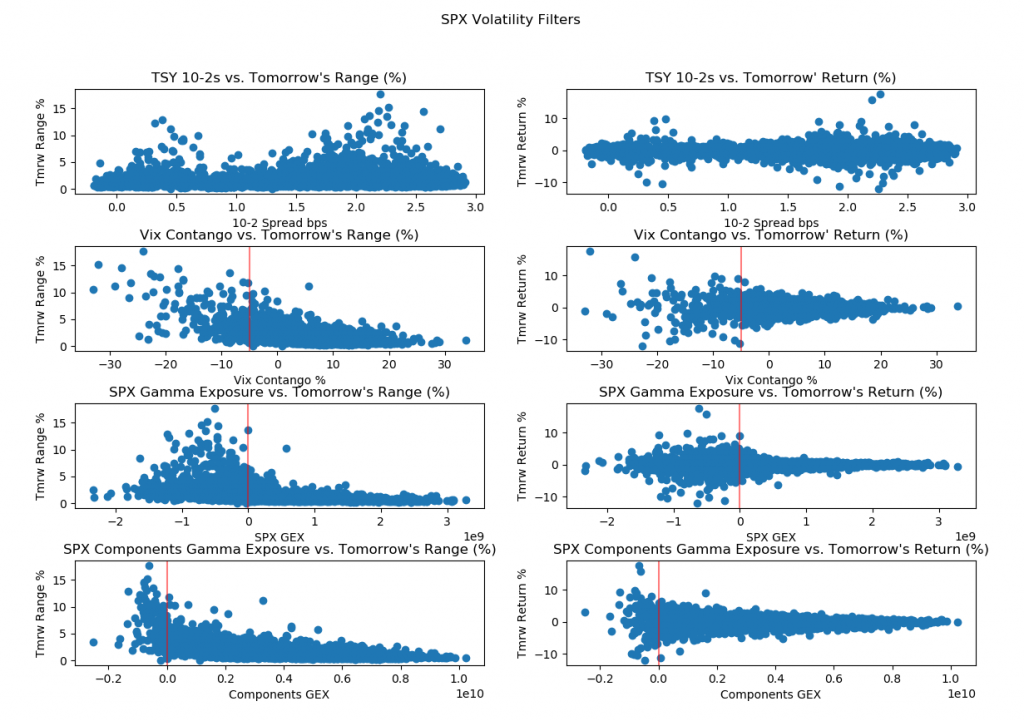
1) Treasury Spreads vs. S&P 500 Futures. When the 10-year yield minus the 2-year yield is too flat or too steep things tend to get volatile. The x-axis is the basis points of this spread. This is the only goldilocks identifier in this post where volatility increases at both extremes of this indicator but mellows out in the middle of the range.
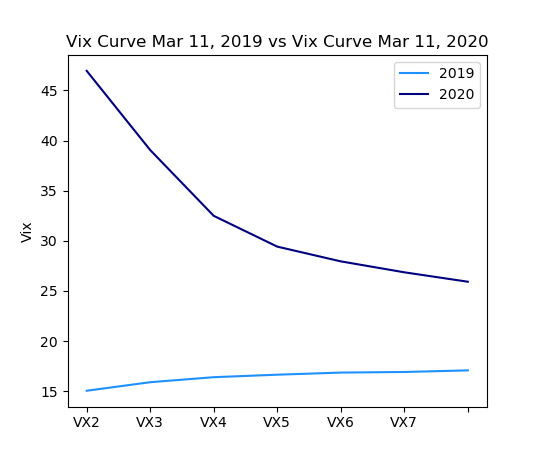
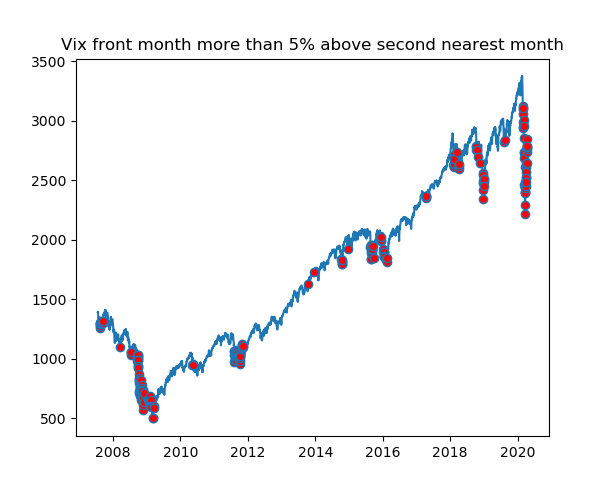
2) Whenever the front month VIX futures contract is trading above the second nearest month by more than 5-10% things tend to get volatile. Here is the VIX futures curve in March of 2019 vs. March 2020 as well as the contango percent.
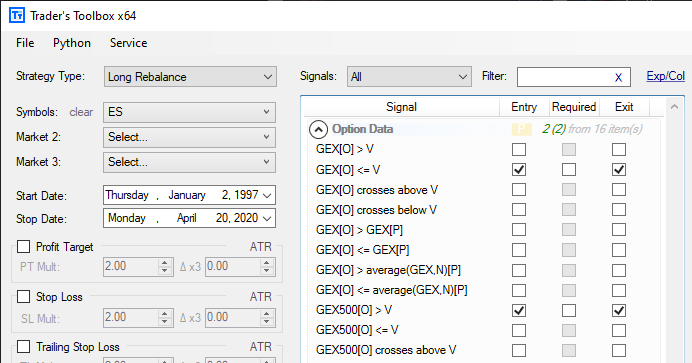
3) Whenever SPX index’s option gamma exposure (GEX) is negative things tend to be more volatile. Gamma exposure is the total sum of gamma (option greek) multiplied by open interest of the calls minus the sum of gamma multiplied by the open interest of the puts. This gives us a sense of where/how option market makers are positioned. When GEX is negative things tend to get volatile.
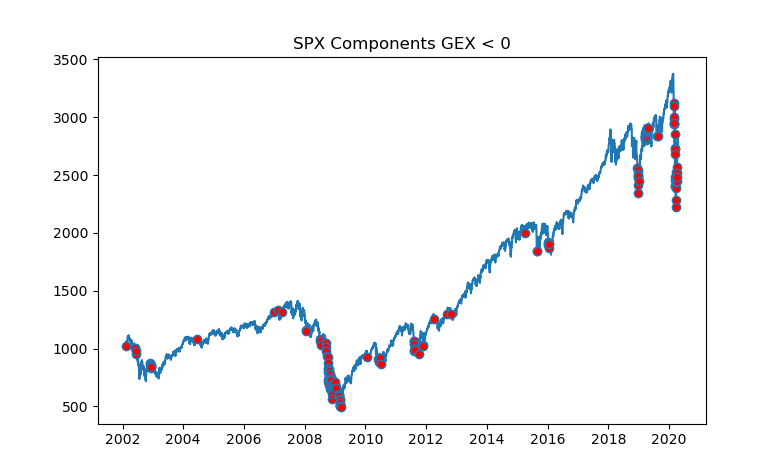
4) Whenever the S&P 500 components’ gamma exposure is negative things tend to be more volatile as well. Obviously very correlated to #3 but important to note the distinction. This is like above but is the aggregate of the actual options on the ~500 stocks in the index vs. the options on the index itself.
There are other volatility identifiers such as Dark Pool Index (DIX), counting the number of S&P 500 stocks above/below the 50 day moving average, number of new highs vs. new lows, economic data filters, etc.
Also, to be fair, Gamma Exposure and Dark Pool Index were first published here: https://squeezemetrics.com/download/white_paper.pdf and pointed out to me by a bunch of Build Alpha users. I want to give credit to where it is due.
In the latest Build Alpha update all of these volatility identifiers, economic data and market breadth filters will be included and testable at the click of a button. Even possible to automate them as part of your strategies built and/or improved by Build Alpha.
I am looking forward to a post COVID world and what the market will bring us on the other side. Be prepared! Any questions please contact me at david@buildalpha.com
Twitter: @DBurgh
No position in any of the mentioned securities at the time of publication. Any opinions expressed herein are solely those of the author, and do not in any way represent the views or opinions of any other person or entity.

: Showing Some Signs of Emerging Strength")

