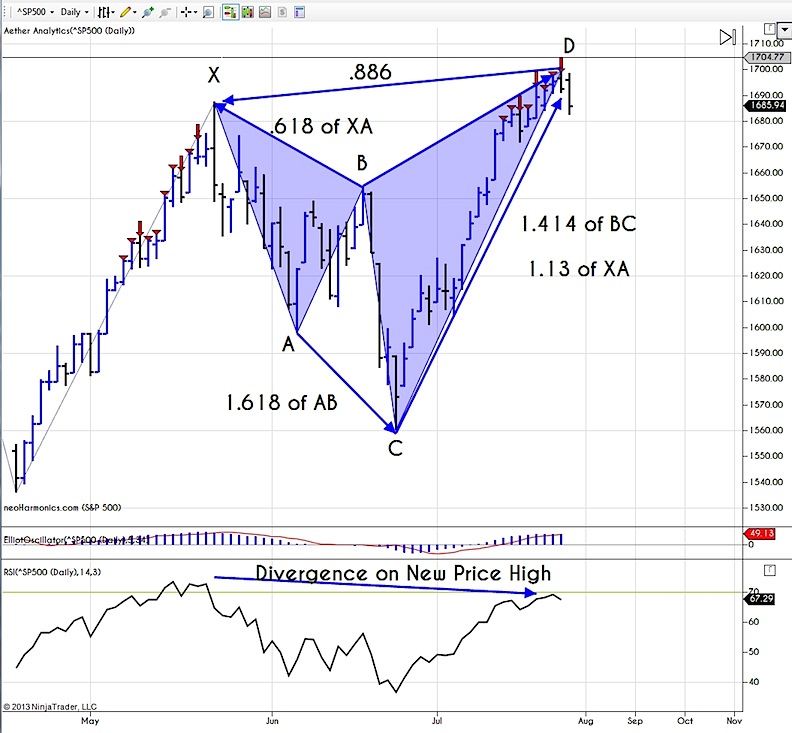
 As I was watching the S&P 500 (SPX) make new highs earlier this week, it dawned on me to go back and look at reciprocal or mirrored patterns in the harmonic market series of patterns. And then it hit me: there is an uncanny resemblance to a bearish bat pattern. I dub this the “backwards bat.” Tested from aetheranalytics!
This particular bearish bat pattern works similar to a butterfly where if you get a momentum divergence at the time of alignment, it raises the probability of the pattern actually reversing. See the chart below with the “backwards” bearish bat pattern:
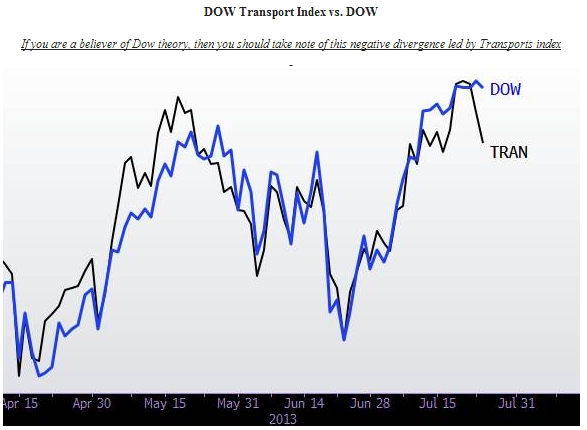
Also here is a divergence in Dow Jones Industrials (DJIA) and Dow Transports (DJT) for those tracking dow theory.
Thanks for reading and good luck trading. Charts from eSignal NeoHarmonics.com and NinjaTrader.com
Also read: Dow Theory Confirmation: Weak Signal or Consolidation?
Twitter: @InterestRateArb and @seeitmarket
No positions in any of the mentioned securities at the time of publication.
Any opinions expressed herein are solely those of the author, and do not in any way represent the views or opinions of any other person or entity.


