While all the headlines are focused on Bitcoin and the new highs for the major stock market indices, the price of gold is creeping higher.
This could be awfully bullish for metal heads. Why? Because gold bulls made lots of noise and were overconfident while the price wavered for the past 3 years. And now when the price is making a move higher, many don’t believe in it.
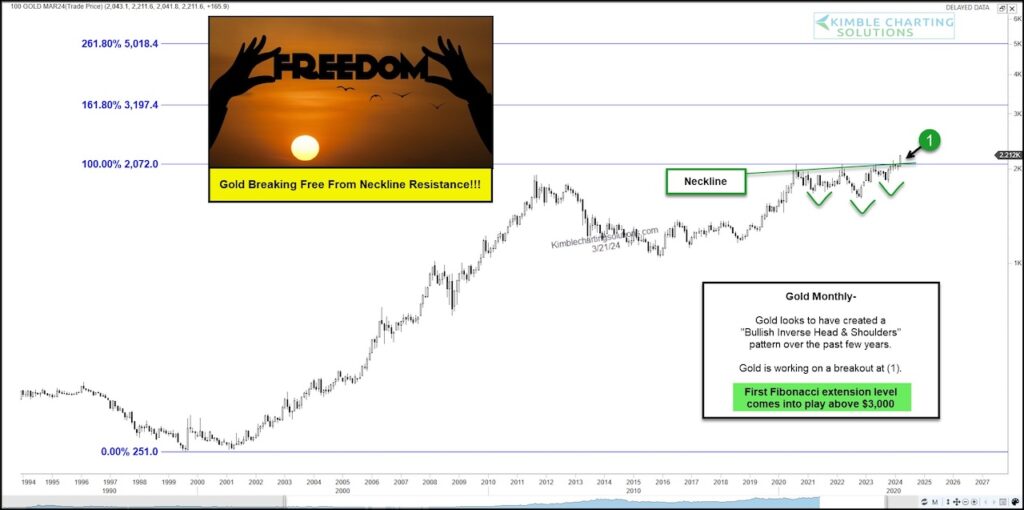
Today, we look at a long-term “monthly” chart of gold. Below, you can see the bullish inverse head and shoulders pattern that formed over the past 3 years while bulls were shaken with indecision. Note that this indecision coincided with all-time highs resistance.
BUT, gold appears to be breaking out above its bullish neckline resistance at (1). And if it sticks, its first fibonacci extension level comes into play around $3000.
So if the breakout sticks, it could be off to the races! Stay tuned!
Gold “monthly” Chart
Note that KimbleCharting is offering a 2 week Free trial to See It Market readers. Just send me an email to services@kimblechartingsolutions.com for details to get set up.
Twitter: @KimbleCharting
The author may have a position in mentioned securities. Any opinions expressed herein are solely those of the author, and do not in any way represent the views or opinions of any other person or entity.


 Set For Revival?")


 Set For Revival?")
